HOT TOPICS LIST
- MACD
- Fibonacci
- RSI
- Gann
- ADXR
- Stochastics
- Volume
- Triangles
- Futures
- Cycles
- Volatility
- ZIGZAG
- MESA
- Retracement
- Aroon
INDICATORS LIST
LIST OF TOPICS
PRINT THIS ARTICLE
by Andrew Hetherington
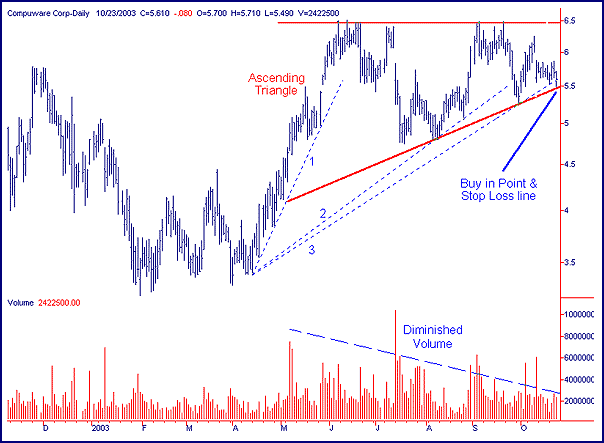
The daily chart of Compuware (CPWR) shows an intriguing 6-month ascending triangle. The volume on this triangle is far from perfect; however, it does diminish from left to right.
Position: N/A
Andrew Hetherington
Classic Dow Theorist who trades as a pure technician, using pattern recognition.
PRINT THIS ARTICLE
CHART ANALYSIS
Compuware Corporation At A Critical Point
10/27/03 08:01:12 AMby Andrew Hetherington
The daily chart of Compuware (CPWR) shows an intriguing 6-month ascending triangle. The volume on this triangle is far from perfect; however, it does diminish from left to right.
Position: N/A
 Figure 1: Daily chart of Compuware. What makes Compuware's ascending triangle so intriguing? One reason is the imperfect volume. Another is the breaching but not quite breaking of the third fan line as well as the intersecting point of the bottom line of the triangle and the fan line. This is an area where I suggest going long on an equity if the general market direction is long. When the general market direction is short I prefer to take a short position off of the top line of a triangle. Lastly, some technicians may consider this a double top. |
| This is a particularly attractive buy in point because it has such limited downside. If the bottom line is broken in the $5.50 area then sell out your long position. I would allow a little room on my stop-loss and have it placed in the $5.20 area. If you aren't comfortable with a 30-cent loss then keep a tighter stop-loss in the $5.35 to $5.40 area. Remember, you are within the pattern and sometimes there are midday breaches that don't close below your line. I suggest waiting towards the end of the trading day to see where the equity will close before being stopped out. |

|
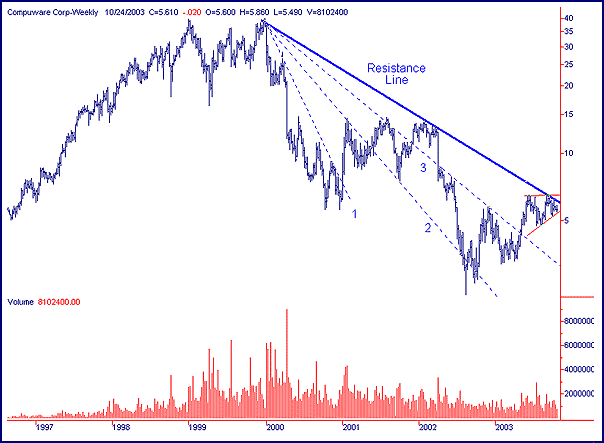
| Figure 2: Weekly chart of Compuware. |
| Graphic provided by: SuperCharts. |
| |
| On the weekly chart the long-term downtrend was broken on higher volume in May 2003. There is overhead resistance in the $6.15 area and this will prove to be quite a challenge to overcome. Heavy volume will be necessary in order to push upwards. If the heavy volume does not accompany the move off of the bottom of the triangle and bounce upwards fast, then it is likely that the anticipated breakout will fizzle out. Finally, a word of caution -- watch the volume closely. |
Classic Dow Theorist who trades as a pure technician, using pattern recognition.
| Toronto, Canada |
Click here for more information about our publications!
Comments
Date: 10/27/03Rank: 5Comment:

|

Request Information From Our Sponsors
- StockCharts.com, Inc.
- Candle Patterns
- Candlestick Charting Explained
- Intermarket Technical Analysis
- John Murphy on Chart Analysis
- John Murphy's Chart Pattern Recognition
- John Murphy's Market Message
- MurphyExplainsMarketAnalysis-Intermarket Analysis
- MurphyExplainsMarketAnalysis-Visual Analysis
- StockCharts.com
- Technical Analysis of the Financial Markets
- The Visual Investor
- VectorVest, Inc.
- Executive Premier Workshop
- One-Day Options Course
- OptionsPro
- Retirement Income Workshop
- Sure-Fire Trading Systems (VectorVest, Inc.)
- Trading as a Business Workshop
- VectorVest 7 EOD
- VectorVest 7 RealTime/IntraDay
- VectorVest AutoTester
- VectorVest Educational Services
- VectorVest OnLine
- VectorVest Options Analyzer
- VectorVest ProGraphics v6.0
- VectorVest ProTrader 7
- VectorVest RealTime Derby Tool
- VectorVest Simulator
- VectorVest Variator
- VectorVest Watchdog
