HOT TOPICS LIST
- MACD
- Fibonacci
- RSI
- Gann
- ADXR
- Stochastics
- Volume
- Triangles
- Futures
- Cycles
- Volatility
- ZIGZAG
- MESA
- Retracement
- Aroon
INDICATORS LIST
LIST OF TOPICS
PRINT THIS ARTICLE
by Arthur Hill
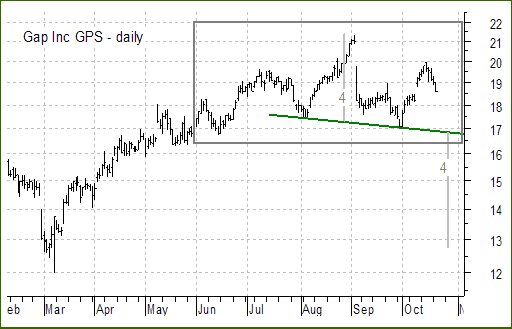
Gap Inc. (GPS) was featured on September 25 with a rising flag (magenta trendlines). The stock broke rising flag support to signal a continuation lower, but suddenly found support at 17 and then advanced to around 20. The flag failed to produce the expected decline, but a head and shoulders pattern is shaping up that could result in further weakness.
Position: Sell
Arthur Hill
Arthur Hill is currently editor of TDTrader.com, a website specializing in trading strategies, sector/industry specific breadth stats and overall technical analysis. He passed the Society of Technical Analysts (STA London) diploma exam with distinction is a Certified Financial Technician (CFTe). Prior to TD Trader, he was the Chief Technical Analyst for Stockcharts.com and the main contributor to the ChartSchool.
PRINT THIS ARTICLE
REV HEAD & SHOULDERS
Gap Inc. Tracing Out Reversal Head And Shoulders Pattern
10/23/03 09:27:17 AMby Arthur Hill
Gap Inc. (GPS) was featured on September 25 with a rising flag (magenta trendlines). The stock broke rising flag support to signal a continuation lower, but suddenly found support at 17 and then advanced to around 20. The flag failed to produce the expected decline, but a head and shoulders pattern is shaping up that could result in further weakness.
Position: Sell
 Figure 1: Daily chart of Gap Inc. This head and shoulders formed over the last three to four months and the pattern features a falling neckline (green trendline). The left shoulder formed in July, the head formed with the early September peak at 21.3 and the right shoulder appears to be taking shape with the October high around 20. The falling neckline reflects selling pressure as the stock broke the August low of 17.4. The pattern would be confirmed with a neckline support break around 16.8 and this would in turn project further weakness to 12.8 (21.3 - 17.3 = 4, 16.8 - 4 = 12.8). |

|
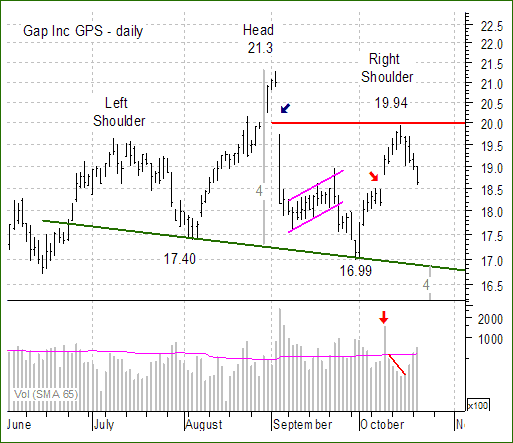
| Figure 2: Recent gaps in the head and shoulders pattern are highlighted with arrows. |
| Graphic provided by: MetaStock. |
| |
| Recent gaps confirm weakness. The early September gap (blue arrow) occurred on high volume and signaled a sudden change of heart among traders and investors. The stock managed to recover, but the gap then provided resistance at 20 in mid-October. Also note that the stock gapped higher on October 9th with a surge in volume (red arrows). Even though the advance continued over the next four days, volume was below average and declined as the stock advanced (red line). Advances depend on volume (fuel) for sustainability and lack of volume increases the likelihood of a failure. With the decline over the last four days, volume has increased and the gap is in jeopardy of being filled, which would be bearish. The October 9th gap should offer support, but if filled on above average volume, the prospects of a neckline support break would greatly increase. |
Arthur Hill is currently editor of TDTrader.com, a website specializing in trading strategies, sector/industry specific breadth stats and overall technical analysis. He passed the Society of Technical Analysts (STA London) diploma exam with distinction is a Certified Financial Technician (CFTe). Prior to TD Trader, he was the Chief Technical Analyst for Stockcharts.com and the main contributor to the ChartSchool.
| Title: | Editor |
| Company: | TDTrader.com |
| Address: | Willem Geetsstraat 17 |
| Mechelen, B2800 | |
| Phone # for sales: | 3215345465 |
| Website: | www.tdtrader.com |
| E-mail address: | arthurh@tdtrader.com |
Traders' Resource Links | |
| TDTrader.com has not added any product or service information to TRADERS' RESOURCE. | |
Click here for more information about our publications!
Comments
Date: 10/27/03Rank: 5Comment:

|

Request Information From Our Sponsors
- StockCharts.com, Inc.
- Candle Patterns
- Candlestick Charting Explained
- Intermarket Technical Analysis
- John Murphy on Chart Analysis
- John Murphy's Chart Pattern Recognition
- John Murphy's Market Message
- MurphyExplainsMarketAnalysis-Intermarket Analysis
- MurphyExplainsMarketAnalysis-Visual Analysis
- StockCharts.com
- Technical Analysis of the Financial Markets
- The Visual Investor
- VectorVest, Inc.
- Executive Premier Workshop
- One-Day Options Course
- OptionsPro
- Retirement Income Workshop
- Sure-Fire Trading Systems (VectorVest, Inc.)
- Trading as a Business Workshop
- VectorVest 7 EOD
- VectorVest 7 RealTime/IntraDay
- VectorVest AutoTester
- VectorVest Educational Services
- VectorVest OnLine
- VectorVest Options Analyzer
- VectorVest ProGraphics v6.0
- VectorVest ProTrader 7
- VectorVest RealTime Derby Tool
- VectorVest Simulator
- VectorVest Variator
- VectorVest Watchdog
