HOT TOPICS LIST
- MACD
- Fibonacci
- RSI
- Gann
- ADXR
- Stochastics
- Volume
- Triangles
- Futures
- Cycles
- Volatility
- ZIGZAG
- MESA
- Retracement
- Aroon
INDICATORS LIST
LIST OF TOPICS
PRINT THIS ARTICLE
by Andrew Hetherington
The daily chart for Aurizon Mines (ARZ-T) shows a breakout from the large 14-month symmetrical triangle on this mining and exploration company.
Position: N/A
Andrew Hetherington
Classic Dow Theorist who trades as a pure technician, using pattern recognition.
PRINT THIS ARTICLE
CHART ANALYSIS
Aurizon Mines In Toronto Poised To Jump
10/23/03 08:58:26 AMby Andrew Hetherington
The daily chart for Aurizon Mines (ARZ-T) shows a breakout from the large 14-month symmetrical triangle on this mining and exploration company.
Position: N/A
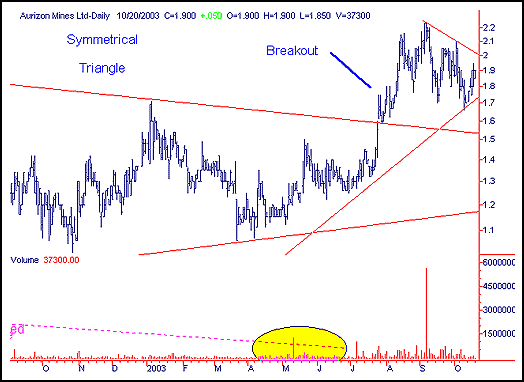
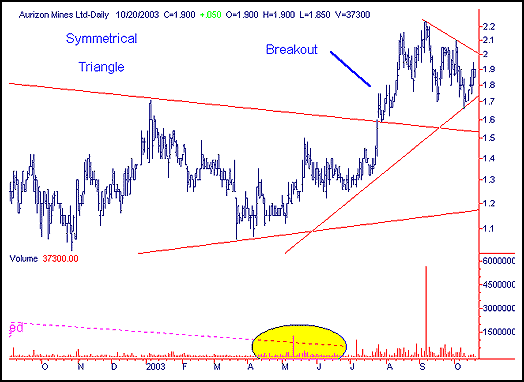
 Figure 1: Daily chart of Aurizon Mines. The daily chart for Aurizon Mines (ARZ-T) shows a breakout from the large 14-month symmetrical triangle for this mining and exploration company. Aurizon Mines is located and traded in Canada. This highly speculative equity has an excellent pattern with diminished volume and a strong breakout in the $1.60 area on much higher volume. There is an early warning of higher prices with an increase in activity in the months of April, May and June of 2003. I have not included a small triangle on the chart that formed in May and June of 2003 that is part of the early warning signal. ARZ-T is currently in a hesitation mode prior to the run-up. Normally, you would see a throwback to the line in the $1.50 area, but similar to the Lucent Technologies situation that I wrote about a few months ago, this throwback will not likely drop all the way down to the line. Anticipating the trendline to hold in the $1.70 area is likely, but if it does break I would continue to add to my long position all the way down to the $1.55 area. Naturally, if the triangle line in the $1.50 area were broken I would bail out of all long positions since this equity would be untrustworthy from a technical standpoint. |
| I anticipate this equity to go to all time highs above the previous all time high of $2.35 CDN. This would be at least a 50% return. However, I expect it to "pop" higher if our prognostication is correct. Speculative mining equities can be dangerous as well as profitable so I urge caution to anyone who does not have an entrepreneurial spirit and to look elsewhere. |

|
| Figure 2: Weekly chart of Aurizon Mines. |
| Graphic provided by: SuperCharts. |
| |
Classic Dow Theorist who trades as a pure technician, using pattern recognition.
| Toronto, Canada |
Click here for more information about our publications!
Comments

|

Request Information From Our Sponsors
- StockCharts.com, Inc.
- Candle Patterns
- Candlestick Charting Explained
- Intermarket Technical Analysis
- John Murphy on Chart Analysis
- John Murphy's Chart Pattern Recognition
- John Murphy's Market Message
- MurphyExplainsMarketAnalysis-Intermarket Analysis
- MurphyExplainsMarketAnalysis-Visual Analysis
- StockCharts.com
- Technical Analysis of the Financial Markets
- The Visual Investor
- VectorVest, Inc.
- Executive Premier Workshop
- One-Day Options Course
- OptionsPro
- Retirement Income Workshop
- Sure-Fire Trading Systems (VectorVest, Inc.)
- Trading as a Business Workshop
- VectorVest 7 EOD
- VectorVest 7 RealTime/IntraDay
- VectorVest AutoTester
- VectorVest Educational Services
- VectorVest OnLine
- VectorVest Options Analyzer
- VectorVest ProGraphics v6.0
- VectorVest ProTrader 7
- VectorVest RealTime Derby Tool
- VectorVest Simulator
- VectorVest Variator
- VectorVest Watchdog
