HOT TOPICS LIST
- MACD
- Fibonacci
- RSI
- Gann
- ADXR
- Stochastics
- Volume
- Triangles
- Futures
- Cycles
- Volatility
- ZIGZAG
- MESA
- Retracement
- Aroon
INDICATORS LIST
LIST OF TOPICS
PRINT THIS ARTICLE
by Andrew Hetherington
This may take some time to reach but anticipating a strong move is reasonable given the multiple, near perfect pattern forming for Check Point Software.
Position: N/A
Andrew Hetherington
Classic Dow Theorist who trades as a pure technician, using pattern recognition.
PRINT THIS ARTICLE
CHART ANALYSIS
Check Point Software (CHKP) Is Repeating Patterns
10/21/03 09:22:07 AMby Andrew Hetherington
This may take some time to reach but anticipating a strong move is reasonable given the multiple, near perfect pattern forming for Check Point Software.
Position: N/A
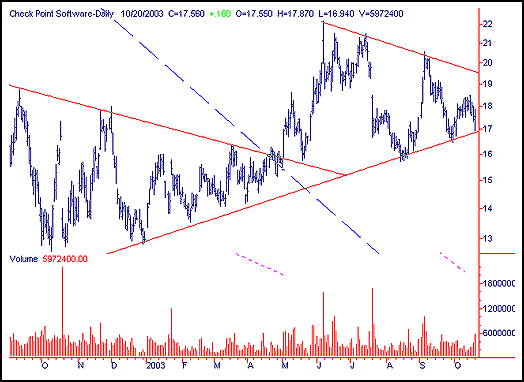
 Figure 1: Daily chart of CHKP. The daily chart shows a consolidation 5-month symmetrical triangle that, when complete, will likely be a 6- to 7-month triangle. The volume on the pattern is close to perfect and is currently approaching the bottom trendline where it will be the optimum buy point for a long position. Naturally, the pattern is still forming and a word of caution is necessary. However, this is an opportunity off of the bottom line with very limited downside. If the bottom line is breached or broken and the equity goes below $16.50 then it would be prudent to sell your long position. If the $16.80 line holds strong and ricochets off to higher levels then you will be in a safe, profitable position for some time to come. I've suggested a stop-loss of $16.50 to give the equity some breathing room on the way down. A buy point anywhere in the $17.00 - $17.90 range is acceptable. The anticipated breakout will occur at the $19.50 trendline. |

|
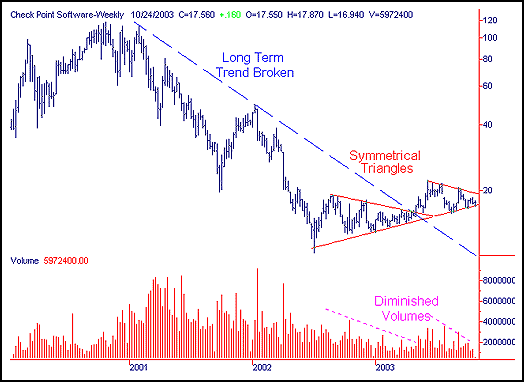
| Figure 2: Weekly chart of CHKP. |
| Graphic provided by: SuperCharts. |
| |
| The weekly chart shows another bottom reversal symmetrical triangle that is 10 months in duration. This slightly larger triangle has near perfect volume as well. This is where the push upwards is originating. The long-term trend was broken on increased volume in April of 2003, then it consolidated forming another triangle and it looks ready to move higher soon. The anticipated resistance lines are $22.00, $26.00, and eventually $38.00. |
Classic Dow Theorist who trades as a pure technician, using pattern recognition.
| Toronto, Canada |
Click here for more information about our publications!
Comments
Date: 10/25/03Rank: 5Comment:
Date: 10/30/03Rank: 5Comment:

Request Information From Our Sponsors
- StockCharts.com, Inc.
- Candle Patterns
- Candlestick Charting Explained
- Intermarket Technical Analysis
- John Murphy on Chart Analysis
- John Murphy's Chart Pattern Recognition
- John Murphy's Market Message
- MurphyExplainsMarketAnalysis-Intermarket Analysis
- MurphyExplainsMarketAnalysis-Visual Analysis
- StockCharts.com
- Technical Analysis of the Financial Markets
- The Visual Investor
- VectorVest, Inc.
- Executive Premier Workshop
- One-Day Options Course
- OptionsPro
- Retirement Income Workshop
- Sure-Fire Trading Systems (VectorVest, Inc.)
- Trading as a Business Workshop
- VectorVest 7 EOD
- VectorVest 7 RealTime/IntraDay
- VectorVest AutoTester
- VectorVest Educational Services
- VectorVest OnLine
- VectorVest Options Analyzer
- VectorVest ProGraphics v6.0
- VectorVest ProTrader 7
- VectorVest RealTime Derby Tool
- VectorVest Simulator
- VectorVest Variator
- VectorVest Watchdog
