

HOT TOPICS LIST
- MACD
- Fibonacci
- RSI
- Gann
- ADXR
- Stochastics
- Volume
- Triangles
- Futures
- Cycles
- Volatility
- ZIGZAG
- MESA
- Retracement
- Aroon
INDICATORS LIST
LIST OF TOPICS
PRINT THIS ARTICLE
by Arthur Hill
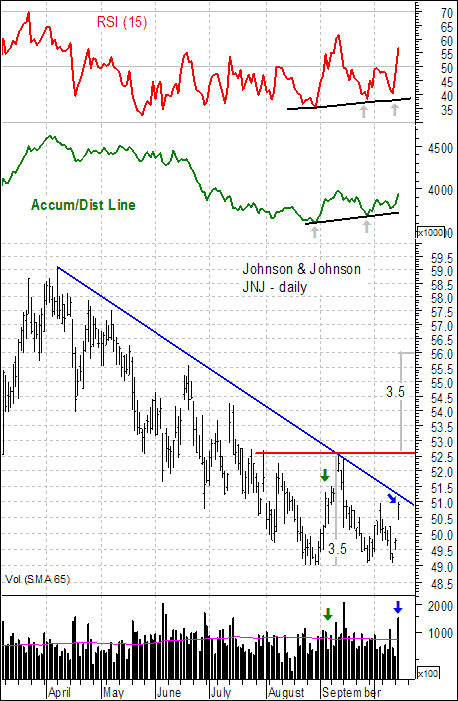
JNJ's recent gap on high volume solidifies support and opens the door to a resistance test and possible double bottom breakout.
Position: Buy
Arthur Hill
Arthur Hill is currently editor of TDTrader.com, a website specializing in trading strategies, sector/industry specific breadth stats and overall technical analysis. He passed the Society of Technical Analysts (STA London) diploma exam with distinction is a Certified Financial Technician (CFTe). Prior to TD Trader, he was the Chief Technical Analyst for Stockcharts.com and the main contributor to the ChartSchool.
PRINT THIS ARTICLE
CHART ANALYSIS
JNJ Trying To Strike A Double Bottom
10/17/03 12:10:30 PMby Arthur Hill
JNJ's recent gap on high volume solidifies support and opens the door to a resistance test and possible double bottom breakout.
Position: Buy
| The stock has been lagging the broader market over the last few months, but found support at 49 at least three times since late August. The early September bounce off support featured above average volume (green arrows). JNJ then declined back to support and held at 49 in late September and again in early October. The subsequent advance and gap higher (blue arrows) occurred on the highest volume since September 15. At the very least, the high volume moves solidify support at 49. At most, these open the door to a resistance test at 52.5. |
|
| Graphic provided by: MetaStock. |
| |
| In addition to the high volume gap, a number of key indicators formed bullish divergences. Most indicators are calculated on a closing basis. Therefore, a divergence should be based on closing prices, not the high-low range. However, technical analysis is a mix of art and science. Scientifically speaking, the August closing low is lower than the September and October closing lows. Artistically speaking, the lows are roughly equal. More important, RSI and the accumulation distribution line formed definitive higher lows in late September and early October (gray arrows). The higher lows in the indicators and equal lows in the stock make for an "artistic" bullish divergence. These divergences show less selling pressure than on the prior low and increase the chances of a successful support bounce. |
| Support at 49 looks solid, but the reaction high at 52.5 holds the key. A move above 52.5 would project further strength to around 56 (52.5 - 49 = 3.5, 52.5 + 3.5 = 56). To find the upside, subtract the pattern high (resistance) from the pattern low (support), and add the difference to the breakout. As long as the gap holds (49.79), it should be considered bullish. A move below the gap would show weakness. A decline below 49 would negate this bullish prognosis. |
Arthur Hill is currently editor of TDTrader.com, a website specializing in trading strategies, sector/industry specific breadth stats and overall technical analysis. He passed the Society of Technical Analysts (STA London) diploma exam with distinction is a Certified Financial Technician (CFTe). Prior to TD Trader, he was the Chief Technical Analyst for Stockcharts.com and the main contributor to the ChartSchool.
| Title: | Editor |
| Company: | TDTrader.com |
| Address: | Willem Geetsstraat 17 |
| Mechelen, B2800 | |
| Phone # for sales: | 3215345465 |
| Website: | www.tdtrader.com |
| E-mail address: | arthurh@tdtrader.com |
Traders' Resource Links | |
| TDTrader.com has not added any product or service information to TRADERS' RESOURCE. | |
Click here for more information about our publications!
Comments
Date:�10/18/03Rank:�5Comment:�I find your articles posted to this web site very informative. I am new to technical analysts and find it to be more confusing than helpful, to many indicators saying to many different things. Where would you suggest someone new to technical analysts begins?
Thanks Earl

Request Information From Our Sponsors
- StockCharts.com, Inc.
- Candle Patterns
- Candlestick Charting Explained
- Intermarket Technical Analysis
- John Murphy on Chart Analysis
- John Murphy's Chart Pattern Recognition
- John Murphy's Market Message
- MurphyExplainsMarketAnalysis-Intermarket Analysis
- MurphyExplainsMarketAnalysis-Visual Analysis
- StockCharts.com
- Technical Analysis of the Financial Markets
- The Visual Investor
- VectorVest, Inc.
- Executive Premier Workshop
- One-Day Options Course
- OptionsPro
- Retirement Income Workshop
- Sure-Fire Trading Systems (VectorVest, Inc.)
- Trading as a Business Workshop
- VectorVest 7 EOD
- VectorVest 7 RealTime/IntraDay
- VectorVest AutoTester
- VectorVest Educational Services
- VectorVest OnLine
- VectorVest Options Analyzer
- VectorVest ProGraphics v6.0
- VectorVest ProTrader 7
- VectorVest RealTime Derby Tool
- VectorVest Simulator
- VectorVest Variator
- VectorVest Watchdog