HOT TOPICS LIST
- MACD
- Fibonacci
- RSI
- Gann
- ADXR
- Stochastics
- Volume
- Triangles
- Futures
- Cycles
- Volatility
- ZIGZAG
- MESA
- Retracement
- Aroon
INDICATORS LIST
LIST OF TOPICS
PRINT THIS ARTICLE
by Arthur Hill
Tibco Software (TIBX) signaled a continuation higher with a neckline breakout confirmed by volume and relative strength.
Position: Buy
Arthur Hill
Arthur Hill is currently editor of TDTrader.com, a website specializing in trading strategies, sector/industry specific breadth stats and overall technical analysis. He passed the Society of Technical Analysts (STA London) diploma exam with distinction is a Certified Financial Technician (CFTe). Prior to TD Trader, he was the Chief Technical Analyst for Stockcharts.com and the main contributor to the ChartSchool.
PRINT THIS ARTICLE
HEAD & SHOULDERS
Tibco Breaks Neckline Resistance
10/20/03 09:47:17 AMby Arthur Hill
Tibco Software (TIBX) signaled a continuation higher with a neckline breakout confirmed by volume and relative strength.
Position: Buy
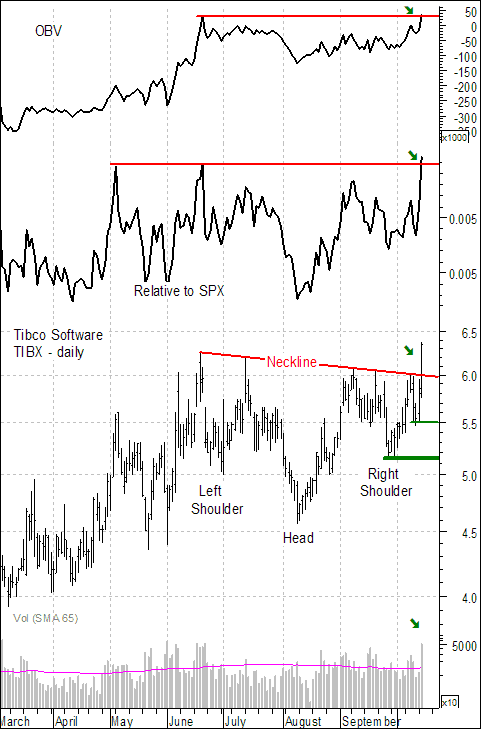
| After an advance from below 4 to above 6, TIBX formed an inverse head and shoulders pattern of the continuation variety (as opposed to the reversal variety). With the prior move up, only two possible patterns could form: a bearish reversal or a bullish continuation. It may sound silly and obvious, but bullish reversals and bearish continuation patterns are simply not feasible in an uptrend. The inverse head and shoulders is typically bullish and this version would be considered a bullish continuation pattern. |

|
| Graphic provided by: MetaStock. |
| |
| The neckline breakout confirms the pattern and projects further strength to around 7.5 (6 - 4.5 = 1.5, 6 + 1.5 = 7.5). The target is found by subtracting neckline resistance from the low of the head and adding the difference to the neckline breakout. Even though 7.5 is the initial target, the breakout could extend higher and should be considered bullish until proven otherwise. A move below support at 5.5 would signal weakness and a decline below the low of the right shoulder would be bearish. |
| Volume and relative strength confirm the breakout. The move above 9 occurred on the highest volume since 20-Jun. A low volume breakout would be questionable, but a high volume breakout is robust and suggests plenty of fuel to sustain an advance. In addition, On Balance Volume (OBV) broke above its June high to confirm strength. It would have been preferable to have OBV leading the way higher, but a simultaneous confirmation is bullish all the same. In addition to OBV, the price relative broke above its May and June highs and TIBC shows excellent relative strength. |
Arthur Hill is currently editor of TDTrader.com, a website specializing in trading strategies, sector/industry specific breadth stats and overall technical analysis. He passed the Society of Technical Analysts (STA London) diploma exam with distinction is a Certified Financial Technician (CFTe). Prior to TD Trader, he was the Chief Technical Analyst for Stockcharts.com and the main contributor to the ChartSchool.
| Title: | Editor |
| Company: | TDTrader.com |
| Address: | Willem Geetsstraat 17 |
| Mechelen, B2800 | |
| Phone # for sales: | 3215345465 |
| Website: | www.tdtrader.com |
| E-mail address: | arthurh@tdtrader.com |
Traders' Resource Links | |
| TDTrader.com has not added any product or service information to TRADERS' RESOURCE. | |
Click here for more information about our publications!
Comments
Date: 10/20/03Rank: 5Comment:

Request Information From Our Sponsors
- StockCharts.com, Inc.
- Candle Patterns
- Candlestick Charting Explained
- Intermarket Technical Analysis
- John Murphy on Chart Analysis
- John Murphy's Chart Pattern Recognition
- John Murphy's Market Message
- MurphyExplainsMarketAnalysis-Intermarket Analysis
- MurphyExplainsMarketAnalysis-Visual Analysis
- StockCharts.com
- Technical Analysis of the Financial Markets
- The Visual Investor
- VectorVest, Inc.
- Executive Premier Workshop
- One-Day Options Course
- OptionsPro
- Retirement Income Workshop
- Sure-Fire Trading Systems (VectorVest, Inc.)
- Trading as a Business Workshop
- VectorVest 7 EOD
- VectorVest 7 RealTime/IntraDay
- VectorVest AutoTester
- VectorVest Educational Services
- VectorVest OnLine
- VectorVest Options Analyzer
- VectorVest ProGraphics v6.0
- VectorVest ProTrader 7
- VectorVest RealTime Derby Tool
- VectorVest Simulator
- VectorVest Variator
- VectorVest Watchdog
