HOT TOPICS LIST
- MACD
- Fibonacci
- RSI
- Gann
- ADXR
- Stochastics
- Volume
- Triangles
- Futures
- Cycles
- Volatility
- ZIGZAG
- MESA
- Retracement
- Aroon
INDICATORS LIST
LIST OF TOPICS
PRINT THIS ARTICLE
by Andrew Hetherington
A strong breakout indicates a good buying opportunity for Semtech. How far will it go?
Position: Buy
Andrew Hetherington
Classic Dow Theorist who trades as a pure technician, using pattern recognition.
PRINT THIS ARTICLE
ASCENDING TRIANGLES
Semtech (SMTC) Is Moving Higher
10/14/03 09:39:16 AMby Andrew Hetherington
A strong breakout indicates a good buying opportunity for Semtech. How far will it go?
Position: Buy

|
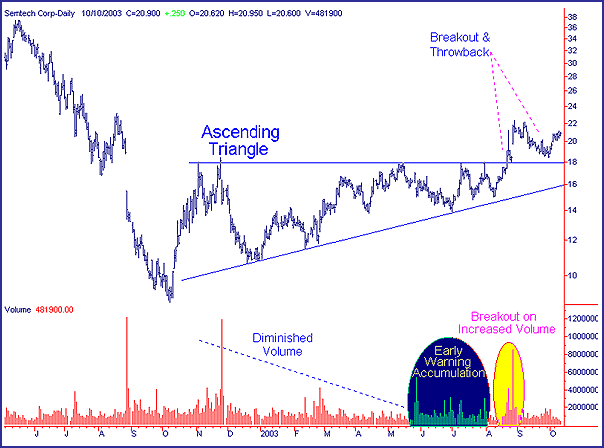
| Figure 1: The daily chart of SMTC. |
| Graphic provided by: SuperCharts. |
| |
| Semtech's daily chart shows a large 1-year ascending triangle. This pattern has nicely diminished volume on its creation. Interestingly, there is a clear early warning of accumulation with the increased activity in June and July of 2003. Some would hypothesize that the volume increase distorts the triangle volume requirements since it doesn't diminish towards the end of the triangle. This would have been correct had it broken the bottom line of the triangle. However, the trendline on the bottom of the triangle held in June of 2003 then it jumped off of the trendline and had a throwback down to the buy point in the $15.25 area in July. |
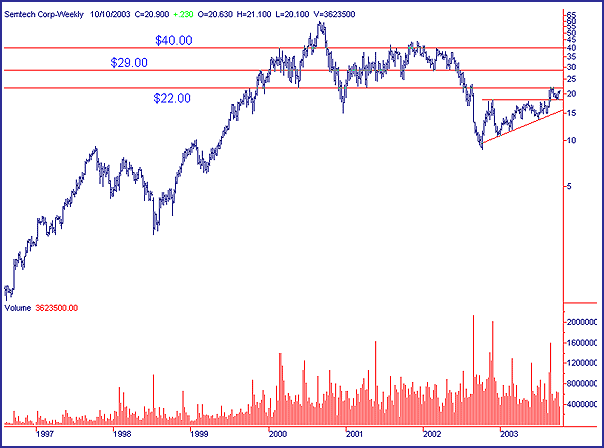
 Figure 2: SMTC's weekly chart. The weekly chart demonstrates the strong breakout from $18.00 to $22.00 in August on much higher volume. The usual throwback to the buy point in the $18.50 area ensued and now it will be onward and upward as long as the general market conditions remain strong. There is less risk associated with this pattern now that it has confirmed by breaking topside. Trading off of the bottom trendline in the $15.25 area had a higher degree of risk but would have proven to be a protected and profitable position. Naturally, if the bottom trendline were broken you would sell your long position. |
| The anticipated resistance areas are in the $22.00, $29.00 and $40.00 areas. It's a reasonable prognostication to anticipate $29.00 - $40.00 with this bottom reversal triangle. |
Classic Dow Theorist who trades as a pure technician, using pattern recognition.
| Toronto, Canada |
Click here for more information about our publications!
Comments
Date: 10/22/03Rank: 5Comment:

|

Request Information From Our Sponsors
- StockCharts.com, Inc.
- Candle Patterns
- Candlestick Charting Explained
- Intermarket Technical Analysis
- John Murphy on Chart Analysis
- John Murphy's Chart Pattern Recognition
- John Murphy's Market Message
- MurphyExplainsMarketAnalysis-Intermarket Analysis
- MurphyExplainsMarketAnalysis-Visual Analysis
- StockCharts.com
- Technical Analysis of the Financial Markets
- The Visual Investor
- VectorVest, Inc.
- Executive Premier Workshop
- One-Day Options Course
- OptionsPro
- Retirement Income Workshop
- Sure-Fire Trading Systems (VectorVest, Inc.)
- Trading as a Business Workshop
- VectorVest 7 EOD
- VectorVest 7 RealTime/IntraDay
- VectorVest AutoTester
- VectorVest Educational Services
- VectorVest OnLine
- VectorVest Options Analyzer
- VectorVest ProGraphics v6.0
- VectorVest ProTrader 7
- VectorVest RealTime Derby Tool
- VectorVest Simulator
- VectorVest Variator
- VectorVest Watchdog
