HOT TOPICS LIST
- MACD
- Fibonacci
- RSI
- Gann
- ADXR
- Stochastics
- Volume
- Triangles
- Futures
- Cycles
- Volatility
- ZIGZAG
- MESA
- Retracement
- Aroon
INDICATORS LIST
LIST OF TOPICS
PRINT THIS ARTICLE
by Andrew Hetherington
A large head and shoulders formation in the making gives a possible buy signal for those willing to take a risk.
Position: N/A
Andrew Hetherington
Classic Dow Theorist who trades as a pure technician, using pattern recognition.
PRINT THIS ARTICLE
CHART ANALYSIS
Things Are Going Better For Coke
09/15/03 10:24:03 AMby Andrew Hetherington
A large head and shoulders formation in the making gives a possible buy signal for those willing to take a risk.
Position: N/A
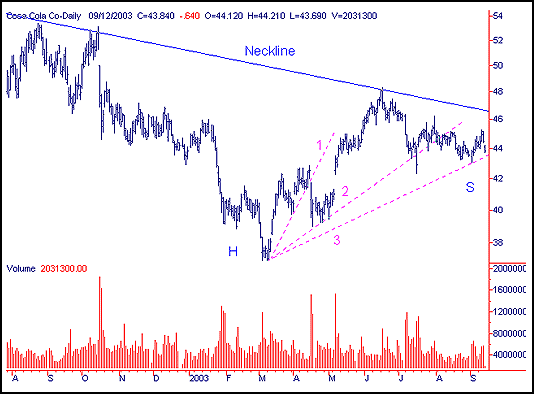
 Figure 1: Daily chart of Coca Cola. On the daily chart of Coca Cola (KO) I've drawn three fan lines. The third fan line is still intact. I'm suggesting, for those with strong stomachs, to take a long position along this line currently in the $43.50 - $43.75 area. This leap of faith is based on an assumption that the right shoulder will stop dropping and round upwards. The demand line, or performance line as I call it, should help push it higher with increasing volumes. If this happens you will be able to catch the ever-elusive bottom. |
| Naturally, a word of caution is necessary since we are still within the pattern; however, there is limited downside risk if you trade along the fan line. Buy long just above the third fan line and if the line is significantly broken, bail out. I would consider a significant breaking of this line if it closes below $43.00, but be aware that this line slopes upwards and changes with each passing day. Some like to use tighter stop-losses, so a stop-loss in the $43.30 area is appropriate for them. However, often these lines are breached but not quite broken so I prefer to give a little leeway since an intraday breach may not close below the line. |

|
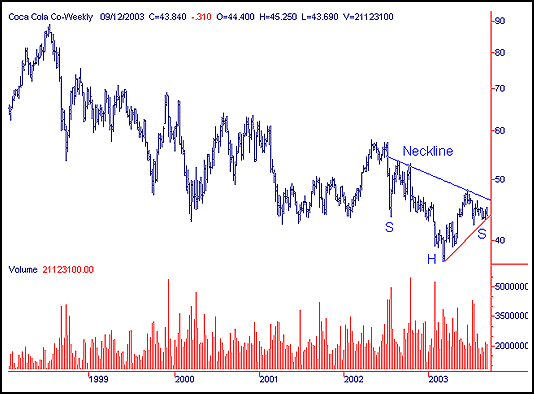
| Figure 2: Weekly chart of Coca Cola. |
| Graphic provided by: SuperCharts. |
| |
| The volume on the weekly chart is not perfect but it does confirm that the pattern exists. In addition the base of the right shoulder has not been reached. I would anticipate larger volumes at this point to help with the bounce upwards. Once this happens, breaking topside of the neckline is likely in the $46.50 area. This neckline slopes downwards so it also changes with each passing day. This is currently a 15-month head and shoulders pattern that may even extend a little longer towards 16 months. Bigger patterns are more powerful and if anticipated correctly you can take a protected position that will not be seen for some time. |
Classic Dow Theorist who trades as a pure technician, using pattern recognition.
| Toronto, Canada |
Click here for more information about our publications!
PRINT THIS ARTICLE

Request Information From Our Sponsors
- StockCharts.com, Inc.
- Candle Patterns
- Candlestick Charting Explained
- Intermarket Technical Analysis
- John Murphy on Chart Analysis
- John Murphy's Chart Pattern Recognition
- John Murphy's Market Message
- MurphyExplainsMarketAnalysis-Intermarket Analysis
- MurphyExplainsMarketAnalysis-Visual Analysis
- StockCharts.com
- Technical Analysis of the Financial Markets
- The Visual Investor
- VectorVest, Inc.
- Executive Premier Workshop
- One-Day Options Course
- OptionsPro
- Retirement Income Workshop
- Sure-Fire Trading Systems (VectorVest, Inc.)
- Trading as a Business Workshop
- VectorVest 7 EOD
- VectorVest 7 RealTime/IntraDay
- VectorVest AutoTester
- VectorVest Educational Services
- VectorVest OnLine
- VectorVest Options Analyzer
- VectorVest ProGraphics v6.0
- VectorVest ProTrader 7
- VectorVest RealTime Derby Tool
- VectorVest Simulator
- VectorVest Variator
- VectorVest Watchdog
