HOT TOPICS LIST
- MACD
- Fibonacci
- RSI
- Gann
- ADXR
- Stochastics
- Volume
- Triangles
- Futures
- Cycles
- Volatility
- ZIGZAG
- MESA
- Retracement
- Aroon
INDICATORS LIST
LIST OF TOPICS
PRINT THIS ARTICLE
by Andrew Hetherington
Six months ago I wrote an article about Juniper Networks (JNPR). I examined the ascending triangle and prognosticated a breakout that came to fruition. In addition, I recommended caution since Juniper was still within the pattern and prudence is always necessary. Now, my performance line along the third fan line is still intact and an update is needed.
Position: N/A
Andrew Hetherington
Classic Dow Theorist who trades as a pure technician, using pattern recognition.
PRINT THIS ARTICLE
CHART ANALYSIS
Revisiting Our Old Friend Juniper Networks
09/05/03 01:19:25 PMby Andrew Hetherington
Six months ago I wrote an article about Juniper Networks (JNPR). I examined the ascending triangle and prognosticated a breakout that came to fruition. In addition, I recommended caution since Juniper was still within the pattern and prudence is always necessary. Now, my performance line along the third fan line is still intact and an update is needed.
Position: N/A
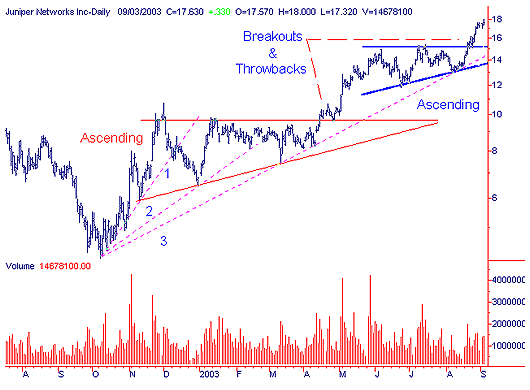
 Figure 1: Daily chart of Juniper Networks. A consolidation-ascending triangle has formed and broken topside. This 4-month triangle has perfectly diminished volume on the creation of the pattern. There is a strong breakout on increasing volume, and a throwback to the line in the $16.00 area is likely. This throwback may even go as low as $15.00 depending on the general market conditions. If there is no throwback of substance then I would not take any new long positions. However, if there is a throwback I would take a new long position and stay long until my performance line breaks. A stop-loss just below this line will help keep you out of danger and preserve your capital in the event of an error in the forecast. |

|
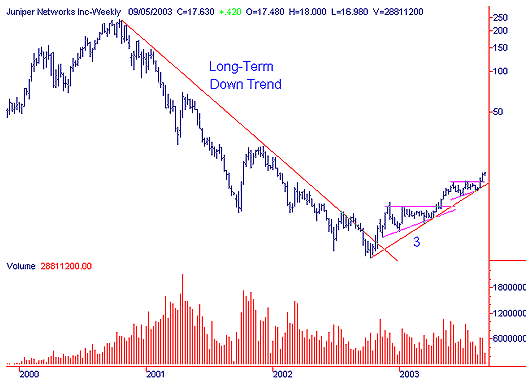
| Figure 2: Weekly chart of Juniper Networks. |
| Graphic provided by: SuperCharts. |
| |
| On the weekly chart, the long-term downtrend was broken last November and the bottom reversal and consolidation triangles are clear evidence of much higher prices and a rising confidence level in this equity. The next ride up will see the $28.00 area resistance. |
Classic Dow Theorist who trades as a pure technician, using pattern recognition.
| Toronto, Canada |
Click here for more information about our publications!
PRINT THIS ARTICLE

Request Information From Our Sponsors
- StockCharts.com, Inc.
- Candle Patterns
- Candlestick Charting Explained
- Intermarket Technical Analysis
- John Murphy on Chart Analysis
- John Murphy's Chart Pattern Recognition
- John Murphy's Market Message
- MurphyExplainsMarketAnalysis-Intermarket Analysis
- MurphyExplainsMarketAnalysis-Visual Analysis
- StockCharts.com
- Technical Analysis of the Financial Markets
- The Visual Investor
- VectorVest, Inc.
- Executive Premier Workshop
- One-Day Options Course
- OptionsPro
- Retirement Income Workshop
- Sure-Fire Trading Systems (VectorVest, Inc.)
- Trading as a Business Workshop
- VectorVest 7 EOD
- VectorVest 7 RealTime/IntraDay
- VectorVest AutoTester
- VectorVest Educational Services
- VectorVest OnLine
- VectorVest Options Analyzer
- VectorVest ProGraphics v6.0
- VectorVest ProTrader 7
- VectorVest RealTime Derby Tool
- VectorVest Simulator
- VectorVest Variator
- VectorVest Watchdog
