

HOT TOPICS LIST
- MACD
- Fibonacci
- RSI
- Gann
- ADXR
- Stochastics
- Volume
- Triangles
- Futures
- Cycles
- Volatility
- ZIGZAG
- MESA
- Retracement
- Aroon
INDICATORS LIST
LIST OF TOPICS
PRINT THIS ARTICLE
by Andrew Hetherington
A triangle formation bodes well for higher prices in the near-term for Cisco.
Position: N/A
Andrew Hetherington
Classic Dow Theorist who trades as a pure technician, using pattern recognition.
PRINT THIS ARTICLE
CHART ANALYSIS
What's Up With Cisco Systems?
09/04/03 12:34:22 PMby Andrew Hetherington
A triangle formation bodes well for higher prices in the near-term for Cisco.
Position: N/A
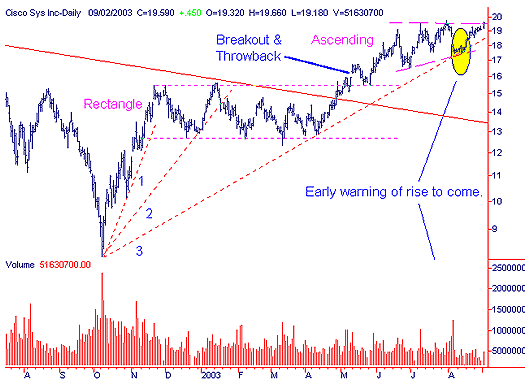 Figure 1: Daily chart of Cisco. The daily chart shows a 6-month rectangle on perfectly diminished volume with a breakout and a throwback to the buy point in the $15.50 area. The next leg up towards the $20.00 area clearly demonstrated a consolidating tendency with the diminished volumes after the strong volumes on the rise. It was a fairly safe guess that higher prices would be on the near-term horizon. In addition, there is the early warning of higher prices in the $18.00 area with the higher volumes bouncing off of the bottom line of the recently created ascending triangle. This triangle has imperfect volume on the pattern creation but it still diminishes. |
| The third fan line has been created and is intact. This performance line I refer to is the safest way to preserve your capital. However, this line is often breached or broken during consolidation before resuming for much higher prices, so a word of caution is necessary. If you are a short-term speculator, this line will help optimize your profit and your stop-loss should be located just under the line. If you have a medium to long-term time horizon, then this line is not as important since it demonstrates a change in the short-term temporary trend. The market bottomed at 7177 and this rally was a good time to place your medium and long-term investments back into equities. |
|
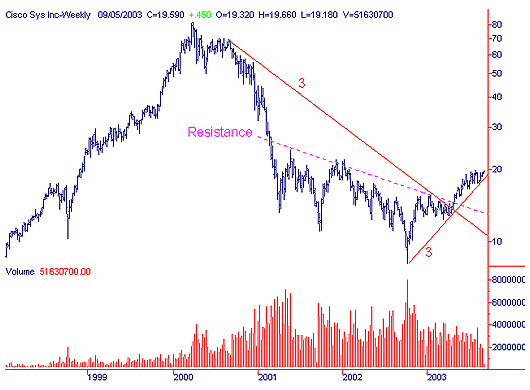
| Figure 2: Weekly chart of Cisco. |
| Graphic provided by: SuperCharts. |
| |
| On the weekly chart a third fan line is breaking topside of the much longer trend with increased volume. Also, this equity has overcome much resistance in the $13.50 area and I expect the next resistance to be in the $21.75 area. Anticipating another consolidation pattern to form once again before resuming the uptrend is likely. After this consolidation another move towards the $29.00 area is probable but this may take time. |
Classic Dow Theorist who trades as a pure technician, using pattern recognition.
| Toronto, Canada |
Click here for more information about our publications!
Comments
Date:�09/10/03Rank:�Comment:�I feel that there is a strong resistance area near 20. A closing above 19.50 is unlikely for the time being. A weekly closing above 19.15 is must and the next target becomes 27 in the medium term.
Date:�09/12/03Rank:�5Comment:�

Request Information From Our Sponsors
- VectorVest, Inc.
- Executive Premier Workshop
- One-Day Options Course
- OptionsPro
- Retirement Income Workshop
- Sure-Fire Trading Systems (VectorVest, Inc.)
- Trading as a Business Workshop
- VectorVest 7 EOD
- VectorVest 7 RealTime/IntraDay
- VectorVest AutoTester
- VectorVest Educational Services
- VectorVest OnLine
- VectorVest Options Analyzer
- VectorVest ProGraphics v6.0
- VectorVest ProTrader 7
- VectorVest RealTime Derby Tool
- VectorVest Simulator
- VectorVest Variator
- VectorVest Watchdog
- StockCharts.com, Inc.
- Candle Patterns
- Candlestick Charting Explained
- Intermarket Technical Analysis
- John Murphy on Chart Analysis
- John Murphy's Chart Pattern Recognition
- John Murphy's Market Message
- MurphyExplainsMarketAnalysis-Intermarket Analysis
- MurphyExplainsMarketAnalysis-Visual Analysis
- StockCharts.com
- Technical Analysis of the Financial Markets
- The Visual Investor