HOT TOPICS LIST
- MACD
- Fibonacci
- RSI
- Gann
- ADXR
- Stochastics
- Volume
- Triangles
- Futures
- Cycles
- Volatility
- ZIGZAG
- MESA
- Retracement
- Aroon
INDICATORS LIST
LIST OF TOPICS
PRINT THIS ARTICLE
by David Penn
A major test of the lows looms for mortgage finance titan Fannie Mae.
Position: N/A
David Penn
Technical Writer for Technical Analysis of STOCKS & COMMODITIES magazine, Working-Money.com, and Traders.com Advantage.
PRINT THIS ARTICLE
SUPPORT & RESISTANCE
Will Fannie Mae Bounce?
08/25/03 12:56:40 PMby David Penn
A major test of the lows looms for mortgage finance titan Fannie Mae.
Position: N/A
| Will there be a Tyco moment for beleagured mortgage market maker Fannie Mae (FNM)? A moment in which smart money becomes convinced that the negatives have been stacked up too high against the company for the company's stock price to appreciate -- or even hold its ground. One of the best things going for technical analysis is that it enables traders and investors to spot "Tyco moments" long before these moments become obvious to the media and general public. |
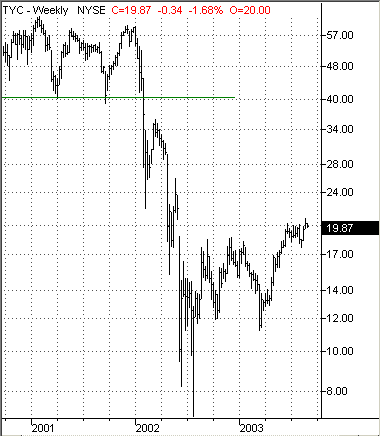
| Tyco's collapse after making all-time highs in the fall of 2000 was short and swift. The stock remained in a range roughly between $55 and $45 for a year after that all-time high. But in the fourth quarter of 2001, Tyco plummeted -- breaking beneath its 2001 lows at $39 and falling to as low as $23 within a few weeks. Tyco bounced from these depths, a rally over the next few months that brought the stock back up above $35. But the rout was on. Following that bounce, Tyco went into free-fall, spending the first half of 2002 falling from more than $35 to under $8. |

|
| Figure 1: When Tyco broke down below $40, the selling pressure became thoroughly overwhelming. |
| Graphic provided by: TradeStation. |
| |
| That was then with Tyco, and this is now with Fannie Mae. But it is worth remembering that negative news on companies like Tyco -- and Enron and Worldcom and Global Crossing and a host of others -- had been accumulating while share prices were still teetering at the edge of the cliff . . . |
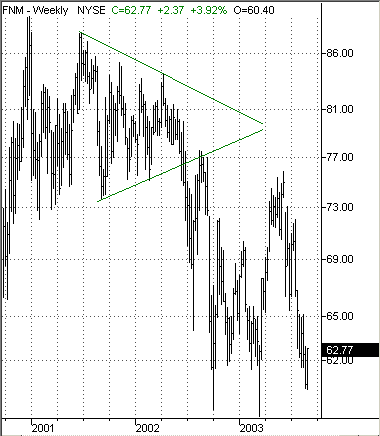
 Figure 2. This symmetrical triangle following a peak in Fannie Mae's share price anticipated significant declines. Where is Fannie Mae now? And now might its price action be in any way reminiscent of that of companies like Tyco? Fannie Mae has been a choppy, sloppy trade more likely to oscillate than trend over any three month period ever since late 1997. After rallying to over $75 early in the summer of 2003, Fannie Mae began correcting in a series of sharp moves that had shares of the company trading near $60 by mid-August -- a decline of 20% in less than three months. The decline has been fairly relentless, which makes its approach to major lows near $58 all the more significant. Fannie Mae has traded near $58 before: most recently $58 marked the trough lows of declines in September 2002 and March 2003. |
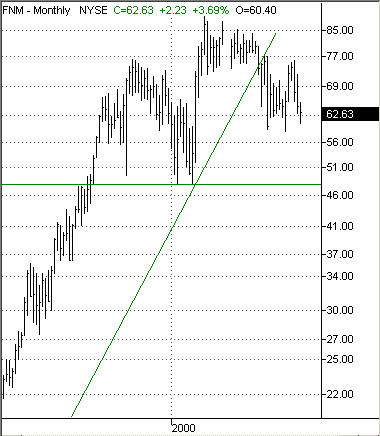
 Figure 3. This long-term, monthly view of Fannie Mae suggests a top in the making. The trendline shown connects to the lows of the fourth quarter of 1987. If Fannie Mae finds support near $58, then the ensuing rebound could be powerful, indeed. After falling below $59 in October 2002, FNM rallied as high as $72 in about two weeks. Falling again to this support level in March 2003, FNM rallied as high as $75 in about three months. However, it should be underscored that a collapse beneath $58 would mean that Fannie Mae would be trading lower than it has since 2000 -- and even then would be more in line with the lows of 2000 than the highs of that year. Trading below $58 would also set up a particularly serious test of long-term support at $48 -- lows marked in March 2000 and tested in August of that year. |
Technical Writer for Technical Analysis of STOCKS & COMMODITIES magazine, Working-Money.com, and Traders.com Advantage.
| Title: | Technical Writer |
| Company: | Technical Analysis, Inc. |
| Address: | 4757 California Avenue SW |
| Seattle, WA 98116 | |
| Phone # for sales: | 206 938 0570 |
| Fax: | 206 938 1307 |
| Website: | www.Traders.com |
| E-mail address: | DPenn@traders.com |
Traders' Resource Links | |
| Charting the Stock Market: The Wyckoff Method -- Books | |
| Working-Money.com -- Online Trading Services | |
| Traders.com Advantage -- Online Trading Services | |
| Technical Analysis of Stocks & Commodities -- Publications and Newsletters | |
| Working Money, at Working-Money.com -- Publications and Newsletters | |
| Traders.com Advantage -- Publications and Newsletters | |
| Professional Traders Starter Kit -- Software | |
Click here for more information about our publications!
PRINT THIS ARTICLE

Request Information From Our Sponsors
- VectorVest, Inc.
- Executive Premier Workshop
- One-Day Options Course
- OptionsPro
- Retirement Income Workshop
- Sure-Fire Trading Systems (VectorVest, Inc.)
- Trading as a Business Workshop
- VectorVest 7 EOD
- VectorVest 7 RealTime/IntraDay
- VectorVest AutoTester
- VectorVest Educational Services
- VectorVest OnLine
- VectorVest Options Analyzer
- VectorVest ProGraphics v6.0
- VectorVest ProTrader 7
- VectorVest RealTime Derby Tool
- VectorVest Simulator
- VectorVest Variator
- VectorVest Watchdog
- StockCharts.com, Inc.
- Candle Patterns
- Candlestick Charting Explained
- Intermarket Technical Analysis
- John Murphy on Chart Analysis
- John Murphy's Chart Pattern Recognition
- John Murphy's Market Message
- MurphyExplainsMarketAnalysis-Intermarket Analysis
- MurphyExplainsMarketAnalysis-Visual Analysis
- StockCharts.com
- Technical Analysis of the Financial Markets
- The Visual Investor
