HOT TOPICS LIST
- MACD
- Fibonacci
- RSI
- Gann
- ADXR
- Stochastics
- Volume
- Triangles
- Futures
- Cycles
- Volatility
- ZIGZAG
- MESA
- Retracement
- Aroon
INDICATORS LIST
LIST OF TOPICS
PRINT THIS ARTICLE
by David Penn
After falling over eight hundred points from its January peak, cocoa looks ready to rally.
Position: N/A
David Penn
Technical Writer for Technical Analysis of STOCKS & COMMODITIES magazine, Working-Money.com, and Traders.com Advantage.
PRINT THIS ARTICLE
DOUBLE BOTTOMS
Cocoa's Double Bottom
08/22/03 01:06:03 PMby David Penn
After falling over eight hundred points from its January peak, cocoa looks ready to rally.
Position: N/A
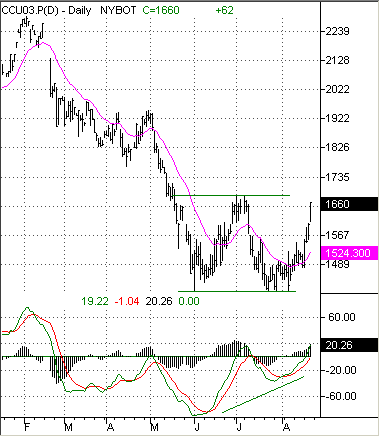
| When I last wrote about cocoa ("Cocoa's Descending Triangle," Traders.com Advantage, March 14, 2003) the outlook for this commodity was decidedly bearish. After rallying as high as 2300 in January (and this as part of an attempt to take out the previous high around 2325 registered in October), cocoa futures (basis September) suffered a high volume, gap breakdown that sent prices plummeting. Although consolidating during the spring between, roughly 1990 and 1800, cocoa prices again broke down in April and continued falling until the early summer, at their lowest point reaching 1420 for a six-month decline of 38%--a colossal bear market, especially for a commodity. Back in March, I warned that cocoa was likely to take out the November lows. That it has -- and then some. |
| However, cocoa futures have since formed a base, roughly between mid-May and mid-August, from which a significant rebound in cocoa prices seems to be increasingly likely. This is suggested largely by way of the double bottom shape this base has taken. After making a low at 1420 in May, cocoa futures rallied as high as 1657 by late June before slipping back as July began. During July, cocoa futures retreated to precisely the level of the May lows, where they found support and have been rallying ever since. |

|
| A successful double bottom in September cocoa could send prices as high as 1940. |
| Graphic provided by: TradeStation. |
| |
| The upside potential of this double bottom is underscored by the positive divergence in the moving average convergence/divergence (MACD) indicator. Note that while prices for cocoa futures made troughs of equal depth in June and late July (both declines bottoming at 1420), the MACD troughs during the same time periods registered a higher trough in July compared to the one in June. When an indicator provides a bullish signal at the same time that price action is either bearish or neutral, then a positive divergence has occurred. |
| Positive divergences can often result in prices exploding to the upside, as has been the case with cocoa since it began moving up sharply in mid-August. This move to the upside, in fact, has been so strong that some hesitation (or outright pullback) should probably be expected as prices near a potential breakout level at 1680. Should prices actually break through resistance at 1680, there might be a relatively smooth ride until the next resistance appears in the form of the spring lows around 1800. Resistance here, should it materialize, might be limited however. The measurement rule for double bottoms -- a variation of Stan Weinstein's swing rule -- adds the value of the formation size to the value at the top of the double bottom pattern, a calculation that yields an upside projection of 1940 in an initial move. |
Technical Writer for Technical Analysis of STOCKS & COMMODITIES magazine, Working-Money.com, and Traders.com Advantage.
| Title: | Technical Writer |
| Company: | Technical Analysis, Inc. |
| Address: | 4757 California Avenue SW |
| Seattle, WA 98116 | |
| Phone # for sales: | 206 938 0570 |
| Fax: | 206 938 1307 |
| Website: | www.Traders.com |
| E-mail address: | DPenn@traders.com |
Traders' Resource Links | |
| Charting the Stock Market: The Wyckoff Method -- Books | |
| Working-Money.com -- Online Trading Services | |
| Traders.com Advantage -- Online Trading Services | |
| Technical Analysis of Stocks & Commodities -- Publications and Newsletters | |
| Working Money, at Working-Money.com -- Publications and Newsletters | |
| Traders.com Advantage -- Publications and Newsletters | |
| Professional Traders Starter Kit -- Software | |
Click here for more information about our publications!
PRINT THIS ARTICLE

Request Information From Our Sponsors
- StockCharts.com, Inc.
- Candle Patterns
- Candlestick Charting Explained
- Intermarket Technical Analysis
- John Murphy on Chart Analysis
- John Murphy's Chart Pattern Recognition
- John Murphy's Market Message
- MurphyExplainsMarketAnalysis-Intermarket Analysis
- MurphyExplainsMarketAnalysis-Visual Analysis
- StockCharts.com
- Technical Analysis of the Financial Markets
- The Visual Investor
- VectorVest, Inc.
- Executive Premier Workshop
- One-Day Options Course
- OptionsPro
- Retirement Income Workshop
- Sure-Fire Trading Systems (VectorVest, Inc.)
- Trading as a Business Workshop
- VectorVest 7 EOD
- VectorVest 7 RealTime/IntraDay
- VectorVest AutoTester
- VectorVest Educational Services
- VectorVest OnLine
- VectorVest Options Analyzer
- VectorVest ProGraphics v6.0
- VectorVest ProTrader 7
- VectorVest RealTime Derby Tool
- VectorVest Simulator
- VectorVest Variator
- VectorVest Watchdog
