HOT TOPICS LIST
- MACD
- Fibonacci
- RSI
- Gann
- ADXR
- Stochastics
- Volume
- Triangles
- Futures
- Cycles
- Volatility
- ZIGZAG
- MESA
- Retracement
- Aroon
INDICATORS LIST
LIST OF TOPICS
PRINT THIS ARTICLE
by Arthur Hill
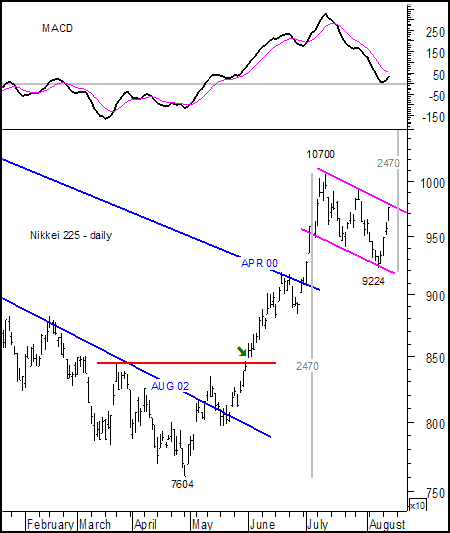
Is this bull for real? Over the last few months, the Nikkei 225 advanced from 7604 to 10070 for a mammoth 2470 point gain. That's over 30% in 50 days.
Position: N/A
Arthur Hill
Arthur Hill is currently editor of TDTrader.com, a website specializing in trading strategies, sector/industry specific breadth stats and overall technical analysis. He passed the Society of Technical Analysts (STA London) diploma exam with distinction is a Certified Financial Technician (CFTe). Prior to TD Trader, he was the Chief Technical Analyst for Stockcharts.com and the main contributor to the ChartSchool.
PRINT THIS ARTICLE
FLAGS AND PENNANTS
Nikkei Forms Large Flag
08/15/03 08:09:30 AMby Arthur Hill
Is this bull for real? Over the last few months, the Nikkei 225 advanced from 7604 to 10070 for a mammoth 2470 point gain. That's over 30% in 50 days.
Position: N/A
| The Nikkei advance broke above the trendlines extending down from Aug-02 and Apr-00. Perhaps more importantly, this is the largest 50-day move (percentage wise) in over 20 years and seems to suggest more that this is more than just a reaction rally. |
| Since moving above 9000, the index peaked around 10000 and formed a falling flag. Flags are consolidation patterns that usually result in a resumption of the prior trend. Flags that slope down are generally bullish and flags that slope up are generally bearish. With the prior move up and the flag sloping down, this looks like a bullish continuation pattern. |

|
| Graphic provided by: MetaStock. |
| |
| A move above the upper trendline would signal a continuation higher and project further strength to around 11700 (10070 - 7600 = 2470, 9224 + 2470 = 11694). Flags are said to fly at half-mast and the resumption move is expected to be equal to the prior advance (the flag pole from 7600 to 10070). |
| It is wise to respect the bears as long as the flag falls. The Nikkei traced out a series of lower lows and lower highs over the last few weeks. While this looks like corrective selling pressure, it is selling pressure all the same and it would be prudent to wait for a bullish signal. On the price chart, that could come from a trendline break or higher high (above 9932). Traders could also turn to MACD and look for a bullish signal line crossover. The current correction carried MACD back to the centerline (zero) and a move above the signal line while still in positive territory would be most positive. |
Arthur Hill is currently editor of TDTrader.com, a website specializing in trading strategies, sector/industry specific breadth stats and overall technical analysis. He passed the Society of Technical Analysts (STA London) diploma exam with distinction is a Certified Financial Technician (CFTe). Prior to TD Trader, he was the Chief Technical Analyst for Stockcharts.com and the main contributor to the ChartSchool.
| Title: | Editor |
| Company: | TDTrader.com |
| Address: | Willem Geetsstraat 17 |
| Mechelen, B2800 | |
| Phone # for sales: | 3215345465 |
| Website: | www.tdtrader.com |
| E-mail address: | arthurh@tdtrader.com |
Traders' Resource Links | |
| TDTrader.com has not added any product or service information to TRADERS' RESOURCE. | |
Click here for more information about our publications!
Comments
Date: 08/19/03Rank: 5Comment:

|

Request Information From Our Sponsors
- StockCharts.com, Inc.
- Candle Patterns
- Candlestick Charting Explained
- Intermarket Technical Analysis
- John Murphy on Chart Analysis
- John Murphy's Chart Pattern Recognition
- John Murphy's Market Message
- MurphyExplainsMarketAnalysis-Intermarket Analysis
- MurphyExplainsMarketAnalysis-Visual Analysis
- StockCharts.com
- Technical Analysis of the Financial Markets
- The Visual Investor
- VectorVest, Inc.
- Executive Premier Workshop
- One-Day Options Course
- OptionsPro
- Retirement Income Workshop
- Sure-Fire Trading Systems (VectorVest, Inc.)
- Trading as a Business Workshop
- VectorVest 7 EOD
- VectorVest 7 RealTime/IntraDay
- VectorVest AutoTester
- VectorVest Educational Services
- VectorVest OnLine
- VectorVest Options Analyzer
- VectorVest ProGraphics v6.0
- VectorVest ProTrader 7
- VectorVest RealTime Derby Tool
- VectorVest Simulator
- VectorVest Variator
- VectorVest Watchdog
