HOT TOPICS LIST
- MACD
- Fibonacci
- RSI
- Gann
- ADXR
- Stochastics
- Volume
- Triangles
- Futures
- Cycles
- Volatility
- ZIGZAG
- MESA
- Retracement
- Aroon
INDICATORS LIST
LIST OF TOPICS
PRINT THIS ARTICLE
by Arthur Hill
Symantec has been battling with resistance in the upper 40s the entire year. With a head and shoulders taking shape over the last three months, the bear may be about to win the war.
Position: Sell
Arthur Hill
Arthur Hill is currently editor of TDTrader.com, a website specializing in trading strategies, sector/industry specific breadth stats and overall technical analysis. He passed the Society of Technical Analysts (STA London) diploma exam with distinction is a Certified Financial Technician (CFTe). Prior to TD Trader, he was the Chief Technical Analyst for Stockcharts.com and the main contributor to the ChartSchool.
PRINT THIS ARTICLE
CHART ANALYSIS
Symantec Having Trouble At 50
07/25/03 10:25:47 AMby Arthur Hill
Symantec has been battling with resistance in the upper 40s the entire year. With a head and shoulders taking shape over the last three months, the bear may be about to win the war.
Position: Sell
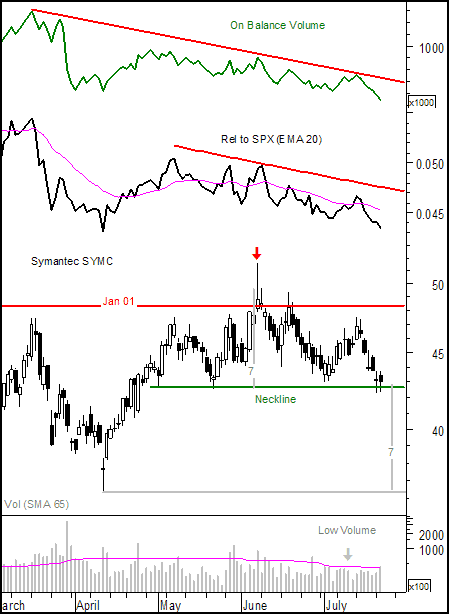
| SYMC formed reaction highs between 45 and 50 no fewer than nine times this year. The June peak actually surpassed 50, but formed a shooting star in the process (red arrow). This peak exceeded the May high and the stock returned to support at 43 for the second time since May. After a low volume advance to 46.12 in early July, the stock is once again trading near support at 43 and the pattern looks like a head and shoulders. There are clearly two support touches to form the neckline and the June highs exceeded the May and July highs (left shoulder and right shoulder). A decisive move below 43 would confirm the head and shoulders as bearish and project further weakness to 36-37, a level confirmed by the April low. |
| Volume plays an important part in a head and shoulders formation. The stock advanced on high volume in late May and early June, but the July advance came on below average volume. This probably helps explain why the stock failed to even test the resistance line. Low volume reflects declining interest in the stock and diminished buying pressure. In addition, on balance volume (OBV) moved to a new reaction low recently. OBV is a daily cumulative indicator that adds volume when the stock is up and subtracts volume when the stock is down. The June advance barely registered on OBV. |

|
| Graphic provided by: MetaStock. |
| |
| In addition to volume, SYMC shows poor relative strength. The price relative measures the performance of SYMC relative to the S&P 500. The price relative peaked in May and formed a bearish divergence over the last few months as the June high failed to exceed the May high. This suggests that SYMC is underperforming the S&P 500 and already becoming out of favor. |
Arthur Hill is currently editor of TDTrader.com, a website specializing in trading strategies, sector/industry specific breadth stats and overall technical analysis. He passed the Society of Technical Analysts (STA London) diploma exam with distinction is a Certified Financial Technician (CFTe). Prior to TD Trader, he was the Chief Technical Analyst for Stockcharts.com and the main contributor to the ChartSchool.
| Title: | Editor |
| Company: | TDTrader.com |
| Address: | Willem Geetsstraat 17 |
| Mechelen, B2800 | |
| Phone # for sales: | 3215345465 |
| Website: | www.tdtrader.com |
| E-mail address: | arthurh@tdtrader.com |
Traders' Resource Links | |
| TDTrader.com has not added any product or service information to TRADERS' RESOURCE. | |
Click here for more information about our publications!
PRINT THIS ARTICLE

|

Request Information From Our Sponsors
- StockCharts.com, Inc.
- Candle Patterns
- Candlestick Charting Explained
- Intermarket Technical Analysis
- John Murphy on Chart Analysis
- John Murphy's Chart Pattern Recognition
- John Murphy's Market Message
- MurphyExplainsMarketAnalysis-Intermarket Analysis
- MurphyExplainsMarketAnalysis-Visual Analysis
- StockCharts.com
- Technical Analysis of the Financial Markets
- The Visual Investor
- VectorVest, Inc.
- Executive Premier Workshop
- One-Day Options Course
- OptionsPro
- Retirement Income Workshop
- Sure-Fire Trading Systems (VectorVest, Inc.)
- Trading as a Business Workshop
- VectorVest 7 EOD
- VectorVest 7 RealTime/IntraDay
- VectorVest AutoTester
- VectorVest Educational Services
- VectorVest OnLine
- VectorVest Options Analyzer
- VectorVest ProGraphics v6.0
- VectorVest ProTrader 7
- VectorVest RealTime Derby Tool
- VectorVest Simulator
- VectorVest Variator
- VectorVest Watchdog
