HOT TOPICS LIST
- MACD
- Fibonacci
- RSI
- Gann
- ADXR
- Stochastics
- Volume
- Triangles
- Futures
- Cycles
- Volatility
- ZIGZAG
- MESA
- Retracement
- Aroon
INDICATORS LIST
LIST OF TOPICS
PRINT THIS ARTICLE
by Andrew Hetherington
Although this equity doesn't jump like it once did, a move towards the $35.00 - $40.00 areas is likely in the short to medium term.
Position: N/A
Andrew Hetherington
Classic Dow Theorist who trades as a pure technician, using pattern recognition.
PRINT THIS ARTICLE
CHART ANALYSIS
Microsoft Ready To Move Higher
07/21/03 12:16:00 PMby Andrew Hetherington
Although this equity doesn't jump like it once did, a move towards the $35.00 - $40.00 areas is likely in the short to medium term.
Position: N/A
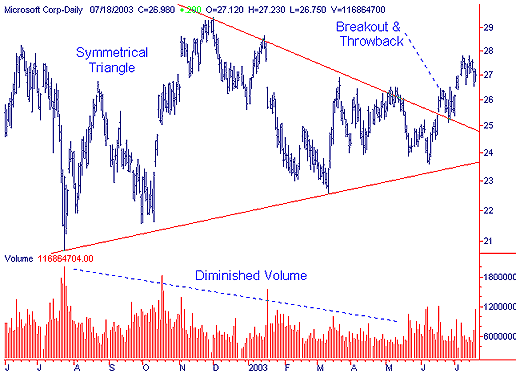
 Figure 1: Daily chart of Microsoft (MSFT). On the daily chart we have a large 11-month symmetrical triangle. The volume on this triangle is slowly diminished and is close to perfect. Microsoft bottomed at $20.70 back in July of 2002. This behemoth leads the way on the Dow similar to the way the financials lead. The breakout is strong on increasing volume and it hesitated, as is usually the case before resuming its up trend. |

|
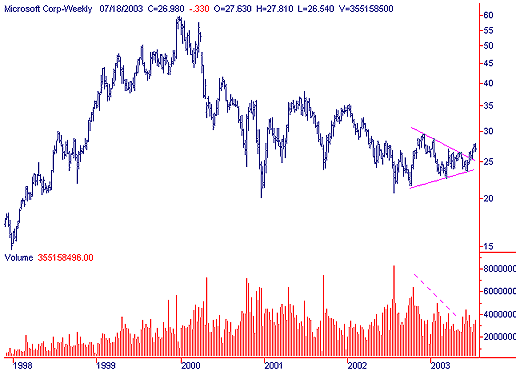
| Figure 2: Weekly chart of Microsoft. |
| Graphic provided by: SuperCharts. |
| |
| The early warning buy signal was in the $24.00 area during May and early June. The volume during this time was increasing significantly and the equity was poised for the $25.50 breakout. |
Classic Dow Theorist who trades as a pure technician, using pattern recognition.
| Toronto, Canada |
Click here for more information about our publications!
Comments
Date: 07/21/03Rank: 4Comment:
Date: 07/22/03Rank: 3Comment: Timeline of target would have been nice.
Date: 07/24/03Rank: 4Comment:

|

Request Information From Our Sponsors
- StockCharts.com, Inc.
- Candle Patterns
- Candlestick Charting Explained
- Intermarket Technical Analysis
- John Murphy on Chart Analysis
- John Murphy's Chart Pattern Recognition
- John Murphy's Market Message
- MurphyExplainsMarketAnalysis-Intermarket Analysis
- MurphyExplainsMarketAnalysis-Visual Analysis
- StockCharts.com
- Technical Analysis of the Financial Markets
- The Visual Investor
- VectorVest, Inc.
- Executive Premier Workshop
- One-Day Options Course
- OptionsPro
- Retirement Income Workshop
- Sure-Fire Trading Systems (VectorVest, Inc.)
- Trading as a Business Workshop
- VectorVest 7 EOD
- VectorVest 7 RealTime/IntraDay
- VectorVest AutoTester
- VectorVest Educational Services
- VectorVest OnLine
- VectorVest Options Analyzer
- VectorVest ProGraphics v6.0
- VectorVest ProTrader 7
- VectorVest RealTime Derby Tool
- VectorVest Simulator
- VectorVest Variator
- VectorVest Watchdog
