HOT TOPICS LIST
- MACD
- Fibonacci
- RSI
- Gann
- ADXR
- Stochastics
- Volume
- Triangles
- Futures
- Cycles
- Volatility
- ZIGZAG
- MESA
- Retracement
- Aroon
INDICATORS LIST
LIST OF TOPICS
PRINT THIS ARTICLE
by Andrew Hetherington
It's a little late to get in, but here's an analysis of a turnaround stock.
Position: Hold
Andrew Hetherington
Classic Dow Theorist who trades as a pure technician, using pattern recognition.
PRINT THIS ARTICLE
CHART ANALYSIS
Broadvision Incorporated (BVSN) Has Turned Around
07/18/03 02:04:49 PMby Andrew Hetherington
It's a little late to get in, but here's an analysis of a turnaround stock.
Position: Hold
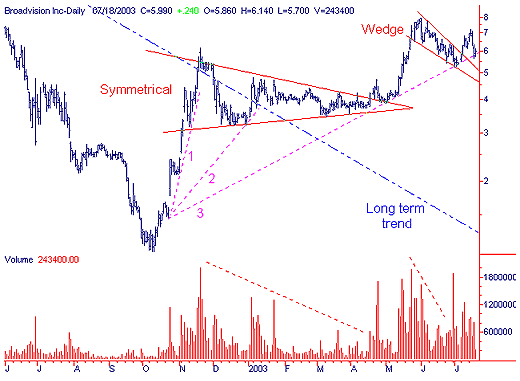
 Figure 1: Daily chart of Broadvision Inc. On the daily chart we have a 6-month symmetrical triangle. Although this triangle is a little long in the tooth, meaning it is farther out towards the apex than I like prior to the breakout, it is still an acceptable triangle. The breakout is on heavy volume, which continued on the ride up from $4.00 to $8.00. The inevitable topping out takes place in the $8.00 area after a fast climb and now it has formed a downsloping wedge. The wedge has diminished volume, as does the triangle. The breakout of the wedge occurs with an increase in activity and has a throwback, as does the triangle. These throwbacks were along the third fan line, and as long as this fan line remains intact a long position should be maintained. |
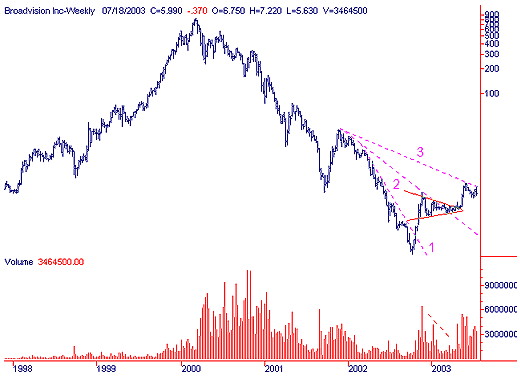
| On the daily chart we can see the long-term down trend was broken in December. On the weekly chart the long-term fan lines and the third fan line will break in the $7.00 area, signaling a change in the long-term direction. |

|
| Figure 2: Weekly chart of Broadvision Inc. |
| Graphic provided by: SuperCharts. |
| |
| This equity has bottomed in the $1.10 area and although these prices will not be seen again for some time, we wouldn't want to take any new long positions unless another consolidation pattern formed. The last opportunity to realistically jump into the fire was on the triangle throwback in the $4.00 area. |
Classic Dow Theorist who trades as a pure technician, using pattern recognition.
| Toronto, Canada |
Click here for more information about our publications!
PRINT THIS ARTICLE

Request Information From Our Sponsors
- StockCharts.com, Inc.
- Candle Patterns
- Candlestick Charting Explained
- Intermarket Technical Analysis
- John Murphy on Chart Analysis
- John Murphy's Chart Pattern Recognition
- John Murphy's Market Message
- MurphyExplainsMarketAnalysis-Intermarket Analysis
- MurphyExplainsMarketAnalysis-Visual Analysis
- StockCharts.com
- Technical Analysis of the Financial Markets
- The Visual Investor
- VectorVest, Inc.
- Executive Premier Workshop
- One-Day Options Course
- OptionsPro
- Retirement Income Workshop
- Sure-Fire Trading Systems (VectorVest, Inc.)
- Trading as a Business Workshop
- VectorVest 7 EOD
- VectorVest 7 RealTime/IntraDay
- VectorVest AutoTester
- VectorVest Educational Services
- VectorVest OnLine
- VectorVest Options Analyzer
- VectorVest ProGraphics v6.0
- VectorVest ProTrader 7
- VectorVest RealTime Derby Tool
- VectorVest Simulator
- VectorVest Variator
- VectorVest Watchdog
