HOT TOPICS LIST
- MACD
- Fibonacci
- RSI
- Gann
- ADXR
- Stochastics
- Volume
- Triangles
- Futures
- Cycles
- Volatility
- ZIGZAG
- MESA
- Retracement
- Aroon
INDICATORS LIST
LIST OF TOPICS
PRINT THIS ARTICLE
by Andrew Hetherington
As many as three different patterns can be found on CMGI's chart, all pointing to a sizeable move up.
Position: Buy
Andrew Hetherington
Classic Dow Theorist who trades as a pure technician, using pattern recognition.
PRINT THIS ARTICLE
CHART ANALYSIS
CMGI Begins Its Breakout
07/15/03 01:03:37 PMby Andrew Hetherington
As many as three different patterns can be found on CMGI's chart, all pointing to a sizeable move up.
Position: Buy
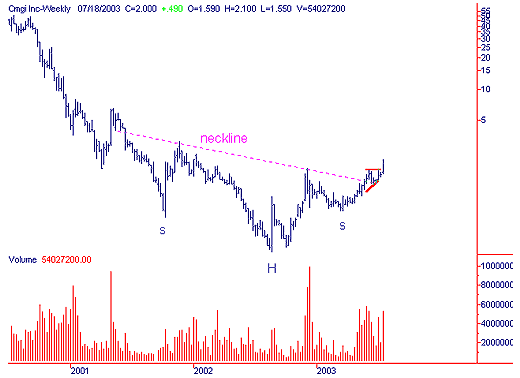
 Figure 1: CMGI's weekly chart. This is a beautiful and powerful chart. The weekly chart illustrates the power behind this recent activity. There is a 2-year head and shoulders bottom reversal pattern with excellent volume on the creation of the pattern. There was dumping on the left shoulder on the way down, then the inevitable small up-move on increased activity. Slowly but surely, there is more dumping towards the head but in a diminished style, finally petering out with the volume at the base of the head. There was a noticeable increase in activity to complete the neckline and then the diminished style once again on the descent of the right shoulder. Finally, there is big volume coming in from the base of the right shoulder until it finally has no alternative but to "pop" and break out. The increased volumes on the right side of the pattern give the early warning of the upcoming breakout. |

|
| Figure 2: CMGI's daily chart. |
| Graphic provided by: SuperCharts. |
| |
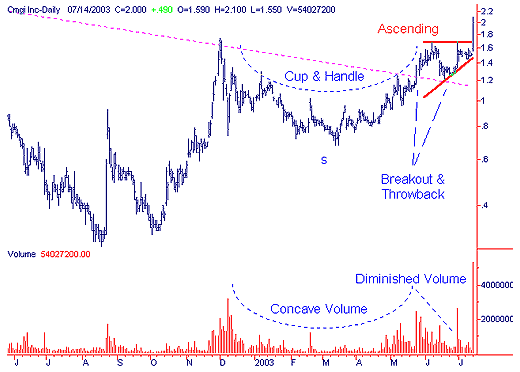
| On the daily chart we see more early evidence of the up-move. The right shoulder is a cup and handle. This often-misdiagnosed pattern has the required concave price movement and volume as well as the diminished volume on the handle. The handle is formed on the breakout, which then becomes a small 1-month ascending triangle. The neckline for the much larger head and shoulders gives the support in the $1.20 area and allows the trader to have confidence when taking a position on such a tricky pattern as the cup and handle. It was only a matter of time before the inevitable journey north. A prognostication of $3.00 in the short to medium term and $6.00 longer term seems likely. |
Classic Dow Theorist who trades as a pure technician, using pattern recognition.
| Toronto, Canada |
Click here for more information about our publications!
Comments
Date: 07/15/03Rank: 4Comment:
Date: 07/15/03Rank: 5Comment:
Date: 07/18/03Rank: 5Comment:
Date: 07/22/03Rank: 4Comment:

Request Information From Our Sponsors
- StockCharts.com, Inc.
- Candle Patterns
- Candlestick Charting Explained
- Intermarket Technical Analysis
- John Murphy on Chart Analysis
- John Murphy's Chart Pattern Recognition
- John Murphy's Market Message
- MurphyExplainsMarketAnalysis-Intermarket Analysis
- MurphyExplainsMarketAnalysis-Visual Analysis
- StockCharts.com
- Technical Analysis of the Financial Markets
- The Visual Investor
- VectorVest, Inc.
- Executive Premier Workshop
- One-Day Options Course
- OptionsPro
- Retirement Income Workshop
- Sure-Fire Trading Systems (VectorVest, Inc.)
- Trading as a Business Workshop
- VectorVest 7 EOD
- VectorVest 7 RealTime/IntraDay
- VectorVest AutoTester
- VectorVest Educational Services
- VectorVest OnLine
- VectorVest Options Analyzer
- VectorVest ProGraphics v6.0
- VectorVest ProTrader 7
- VectorVest RealTime Derby Tool
- VectorVest Simulator
- VectorVest Variator
- VectorVest Watchdog
