HOT TOPICS LIST
- MACD
- Fibonacci
- RSI
- Gann
- ADXR
- Stochastics
- Volume
- Triangles
- Futures
- Cycles
- Volatility
- ZIGZAG
- MESA
- Retracement
- Aroon
INDICATORS LIST
LIST OF TOPICS
PRINT THIS ARTICLE
by Andrew Hetherington
Foundry Networks (FDRY) has bottomed just like most of the other networks. However, they all haven't had the same "pop" as Foundry. This equity rocketed off its bottom of $4.08 in October, 2002 and zoomed to $10.88 on December 2 in less than two months.
Position: N/A
Andrew Hetherington
Classic Dow Theorist who trades as a pure technician, using pattern recognition.
PRINT THIS ARTICLE
CHART ANALYSIS
Foundry Networks Has Turned the Corner
07/15/03 12:58:03 PMby Andrew Hetherington
Foundry Networks (FDRY) has bottomed just like most of the other networks. However, they all haven't had the same "pop" as Foundry. This equity rocketed off its bottom of $4.08 in October, 2002 and zoomed to $10.88 on December 2 in less than two months.
Position: N/A
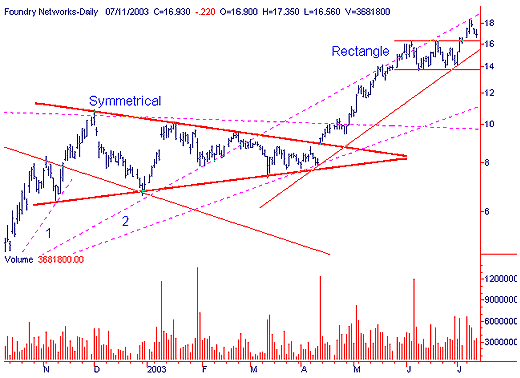
 Figure 1: Daily chart of Foundry Networks. |
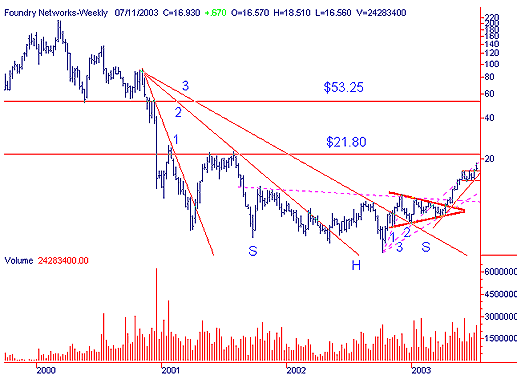
| Here, the daily chart shows a 5-month symmetrical triangle with somewhat diminished volume on the creation of the pattern. Although the volume is imperfect, it is still somewhat diminished. The breakout in April was the prelude to the next breakout from the larger 20-month head and shoulders bottom reversal pattern. This is a large pattern and therefore powerful. The volume on the head and shoulders pattern diminishes on the first half of the pattern, petering out at the base of the head. Then it picks up sharply on the second half increasing as time goes by. There was a strong breakout from the head and shoulders that formed a small 6-day flag, and then it shot up, from $11.65 to $18.51. |

|
| Figure 2: Weekly chart of Foundry Networks. |
| Graphic provided by: SuperCharts. |
| |
| I would stay long on this equity as long as my trendline was intact from the bottom in April to the next bottom in June. This would be a profitable position, but protecting the downside with a stop-loss just underneath this line is the prudent decision. If it breaks this trend and drops toward the third fan line, currently in the $11.00 area, I would use this line as a good re-entry point. There will be much demand along this line. |
Classic Dow Theorist who trades as a pure technician, using pattern recognition.
| Toronto, Canada |
Click here for more information about our publications!
Comments
Date: 07/15/03Rank: 4Comment:

Request Information From Our Sponsors
- StockCharts.com, Inc.
- Candle Patterns
- Candlestick Charting Explained
- Intermarket Technical Analysis
- John Murphy on Chart Analysis
- John Murphy's Chart Pattern Recognition
- John Murphy's Market Message
- MurphyExplainsMarketAnalysis-Intermarket Analysis
- MurphyExplainsMarketAnalysis-Visual Analysis
- StockCharts.com
- Technical Analysis of the Financial Markets
- The Visual Investor
- VectorVest, Inc.
- Executive Premier Workshop
- One-Day Options Course
- OptionsPro
- Retirement Income Workshop
- Sure-Fire Trading Systems (VectorVest, Inc.)
- Trading as a Business Workshop
- VectorVest 7 EOD
- VectorVest 7 RealTime/IntraDay
- VectorVest AutoTester
- VectorVest Educational Services
- VectorVest OnLine
- VectorVest Options Analyzer
- VectorVest ProGraphics v6.0
- VectorVest ProTrader 7
- VectorVest RealTime Derby Tool
- VectorVest Simulator
- VectorVest Variator
- VectorVest Watchdog
