HOT TOPICS LIST
- MACD
- Fibonacci
- RSI
- Gann
- ADXR
- Stochastics
- Volume
- Triangles
- Futures
- Cycles
- Volatility
- ZIGZAG
- MESA
- Retracement
- Aroon
INDICATORS LIST
LIST OF TOPICS
PRINT THIS ARTICLE
by Andrew Hetherington
Lucent Technologies (LU) bottomed on October 11, 2002 at 0.55 cents. Since that time it bounced up as high as $2.75 on May 29, 2003. Of course, all equities have come way off of the bottom, but some, like Lucent, have taken their time to form consolidation and reversal patterns to prepare for their next move upwards.
Position: N/A
Andrew Hetherington
Classic Dow Theorist who trades as a pure technician, using pattern recognition.
PRINT THIS ARTICLE
CHART ANALYSIS
What's Up With Lucent?
07/14/03 11:39:00 AMby Andrew Hetherington
Lucent Technologies (LU) bottomed on October 11, 2002 at 0.55 cents. Since that time it bounced up as high as $2.75 on May 29, 2003. Of course, all equities have come way off of the bottom, but some, like Lucent, have taken their time to form consolidation and reversal patterns to prepare for their next move upwards.
Position: N/A
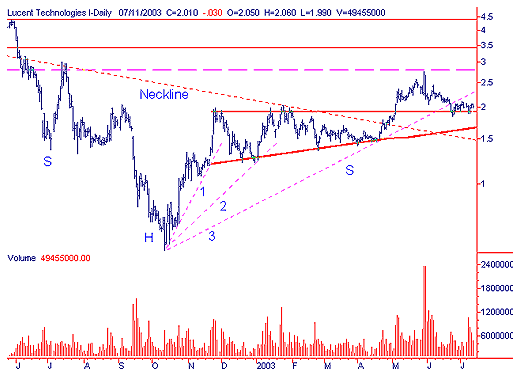
 Figure 1: Daily chart of Lucent. The daily chart of Lucent shows an 11-month head and shoulders bottom reversal pattern with a downsloping neckline. The volume increases from left to right throughout the pattern, but in particular there is much heavier volume from the base of the head to the breakout. The symmetry of the pattern on the left and right side that I so often refer to, is clear on each side of the head where the head looks as if it has multiple shoulders drooping. In actuality, this drooping is part of a wider head and they are not the shoulders since the right side would be much longer in duration compared to the left side of the pattern. This large head and shoulders pattern had a strong breakout, which lasted approximately nine trading days from April 23 - May 5. Why such a long breakout? It was breaking out from two patterns simultaneously. There is a picture perfect 7-month ascending triangle within the head and shoulders pattern. The simultaneous breakouts have now had their customary throwback to the buy point where traders can take a long position in the $2.00 area. The volume on the triangle is perfectly diminished from left to right throughout the pattern. The strong breakouts with increased volume demonstrate that new highs will soon be upon us. The top line of the ascending triangle was the resistance and is now the support in the $1.90 area. |
| There is a small word of caution regarding the third fan line that I've illustrated. These fan lines are not to be trifled with. There has been a breach of the third fan line and the short-term, temporary trend has changed. I'm discounting this fact since it consolidated to form the triangle pattern and the head and shoulders neckline is the next support. This neckline slopes downwards toward the $1.50 area but I doubt if this equity will drop that low so I'm suggesting buying in the $2.00 area. There should be increased demand in the $1.90 area along the support while it gathers steam for the next move upwards. My preference is to take long positions when the equity is temporarily weak and short positions when the equity is temporarily strong. That being said, I take the risk at these junctures even if it is an increased risk. |

|
| Figure 2: Weekly chart of Lucent. |
| Graphic provided by: SuperCharts. |
| |
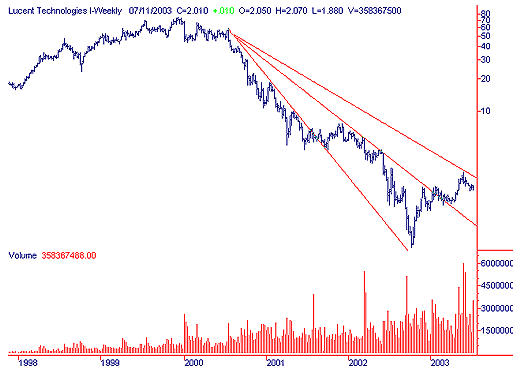
| The long-term downtrend has been broken on the weekly chart and when the $2.40 area is broken; we will be given a clear signal of much higher prices. I'm suggesting this as a medium to long-term hold. In the coming months and years you will look back at this as the bottom and wish you bought a long position at that time. |
Classic Dow Theorist who trades as a pure technician, using pattern recognition.
| Toronto, Canada |
Click here for more information about our publications!
Comments
Date: 07/25/03Rank: 4Comment:

|

Request Information From Our Sponsors
- StockCharts.com, Inc.
- Candle Patterns
- Candlestick Charting Explained
- Intermarket Technical Analysis
- John Murphy on Chart Analysis
- John Murphy's Chart Pattern Recognition
- John Murphy's Market Message
- MurphyExplainsMarketAnalysis-Intermarket Analysis
- MurphyExplainsMarketAnalysis-Visual Analysis
- StockCharts.com
- Technical Analysis of the Financial Markets
- The Visual Investor
- VectorVest, Inc.
- Executive Premier Workshop
- One-Day Options Course
- OptionsPro
- Retirement Income Workshop
- Sure-Fire Trading Systems (VectorVest, Inc.)
- Trading as a Business Workshop
- VectorVest 7 EOD
- VectorVest 7 RealTime/IntraDay
- VectorVest AutoTester
- VectorVest Educational Services
- VectorVest OnLine
- VectorVest Options Analyzer
- VectorVest ProGraphics v6.0
- VectorVest ProTrader 7
- VectorVest RealTime Derby Tool
- VectorVest Simulator
- VectorVest Variator
- VectorVest Watchdog
