HOT TOPICS LIST
- MACD
- Fibonacci
- RSI
- Gann
- ADXR
- Stochastics
- Volume
- Triangles
- Futures
- Cycles
- Volatility
- ZIGZAG
- MESA
- Retracement
- Aroon
INDICATORS LIST
LIST OF TOPICS
PRINT THIS ARTICLE
by Arthur Hill
Even though the recent resistance break at 965 is technically bullish, SPX is starting to get overbought and stalling around 1000.
Position: Hold
Arthur Hill
Arthur Hill is currently editor of TDTrader.com, a website specializing in trading strategies, sector/industry specific breadth stats and overall technical analysis. He passed the Society of Technical Analysts (STA London) diploma exam with distinction is a Certified Financial Technician (CFTe). Prior to TD Trader, he was the Chief Technical Analyst for Stockcharts.com and the main contributor to the ChartSchool.
PRINT THIS ARTICLE
ZIGZAG
SPX: Triple Bottom Breakout or Belated Retracement
07/11/03 02:15:03 PMby Arthur Hill
Even though the recent resistance break at 965 is technically bullish, SPX is starting to get overbought and stalling around 1000.
Position: Hold
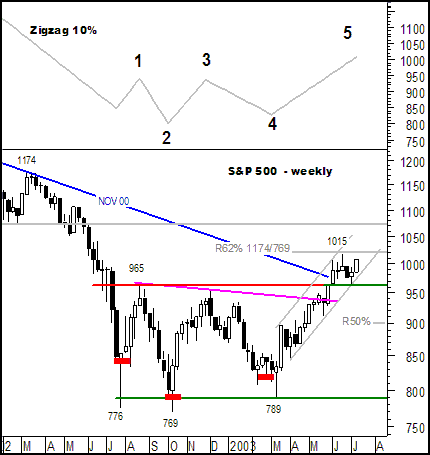
| Looking at the pattern over the past 12 months, a large consolidation formed with resistance at 965 and support around 800. The three lows are not exactly equal (776, 769 and 789), but the essence of a triple bottom is there. If we ignore the spikes (red hash marks), the pattern may even look like a large inverse head-and-shoulders with neckline resistance around 940 (magenta trendline). Anyway you slice it, resistance at 965 was a major hurdle and the ability to clear this level is technically bullish. |
| Since the Jul-02 low, there have been five moves (up or down) of at least 10% (see Zigzag indicator at the top). Five moves in twelve months averages less than three months per move. Did the breakout at 965 herald an end to these relatively short moves and the beginning of a new trend? The key resides in the medium-term trend and the answer is "yes" as long as resistance-turned-support at 965 holds. |

|
| Figure 1: Weekly chart for the S&P 500 Index. |
| Graphic provided by: MetaStock. |
| |
| Since moving above 965, the index has consolidated in the last five to six weeks. Broken resistance at 965 turned into support and the index successfully tested this level in early July. SPX battled with the psychologically important 1000 level all of June and a new resistance level was established at 1015. Even though it may seem belated, 1020 marks a 62% retracement of the prior decline (1174 to 769) and confirms resistance in this area. |
| Consolidations are usually continuation patterns and the prior advance favors an upside break. A breakout at 1015 would signal a continuation higher and the next target would be support-turned-resistance around 1070. Conversely, a support break at 965 would turn the medium-term trend bearish and argue for at least a retracement (about 50%) into the 900 area. |
Arthur Hill is currently editor of TDTrader.com, a website specializing in trading strategies, sector/industry specific breadth stats and overall technical analysis. He passed the Society of Technical Analysts (STA London) diploma exam with distinction is a Certified Financial Technician (CFTe). Prior to TD Trader, he was the Chief Technical Analyst for Stockcharts.com and the main contributor to the ChartSchool.
| Title: | Editor |
| Company: | TDTrader.com |
| Address: | Willem Geetsstraat 17 |
| Mechelen, B2800 | |
| Phone # for sales: | 3215345465 |
| Website: | www.tdtrader.com |
| E-mail address: | arthurh@tdtrader.com |
Traders' Resource Links | |
| TDTrader.com has not added any product or service information to TRADERS' RESOURCE. | |
Click here for more information about our publications!
Comments
Date: 07/14/03Rank: 5Comment:
always helpful to see another insightful perspecitve..
Date: 07/15/03Rank: 4Comment:
Date: 02/03/04Rank: 4Comment:

Request Information From Our Sponsors
- StockCharts.com, Inc.
- Candle Patterns
- Candlestick Charting Explained
- Intermarket Technical Analysis
- John Murphy on Chart Analysis
- John Murphy's Chart Pattern Recognition
- John Murphy's Market Message
- MurphyExplainsMarketAnalysis-Intermarket Analysis
- MurphyExplainsMarketAnalysis-Visual Analysis
- StockCharts.com
- Technical Analysis of the Financial Markets
- The Visual Investor
- VectorVest, Inc.
- Executive Premier Workshop
- One-Day Options Course
- OptionsPro
- Retirement Income Workshop
- Sure-Fire Trading Systems (VectorVest, Inc.)
- Trading as a Business Workshop
- VectorVest 7 EOD
- VectorVest 7 RealTime/IntraDay
- VectorVest AutoTester
- VectorVest Educational Services
- VectorVest OnLine
- VectorVest Options Analyzer
- VectorVest ProGraphics v6.0
- VectorVest ProTrader 7
- VectorVest RealTime Derby Tool
- VectorVest Simulator
- VectorVest Variator
- VectorVest Watchdog
