HOT TOPICS LIST
- MACD
- Fibonacci
- RSI
- Gann
- ADXR
- Stochastics
- Volume
- Triangles
- Futures
- Cycles
- Volatility
- ZIGZAG
- MESA
- Retracement
- Aroon
INDICATORS LIST
LIST OF TOPICS
PRINT THIS ARTICLE
by David Penn
After a short, sharp rally at the beginning of May, wheat futures are headed back down.
Position: N/A
David Penn
Technical Writer for Technical Analysis of STOCKS & COMMODITIES magazine, Working-Money.com, and Traders.com Advantage.
PRINT THIS ARTICLE
DOUBLE TOPS
An Intermediate Double Top in September Wheat
06/26/03 02:27:58 PMby David Penn
After a short, sharp rally at the beginning of May, wheat futures are headed back down.
Position: N/A
| I last took a good look at wheat futures in February. At the time, I believed that a bullish case for wheat was developing as a result of what appeared to be a short-term, head and shoulders bottom developing in January and February 2003 ("A Bottom in Grains?", Traders.com Advantage, February 18, 2003). However, instead of breaking out above the early February highs, wheat futures reversed course and began moving swiftly lower, taking out the January lows by the middle of February. |
| Wheat futures continued to move lower until March. During the course of March and April, wheat futures consolidated in a range between, roughly 278 and 294 (basis continuous futures). Near the end of April, wheat futures rallied sharply, retracing the entirety of the February-March decline. However, once again wheat futures met resistance at this level in May and fell back over the balance of the month. As of late June, wheat futures had retraced approximately 50% of their late April/early May rally. |

|
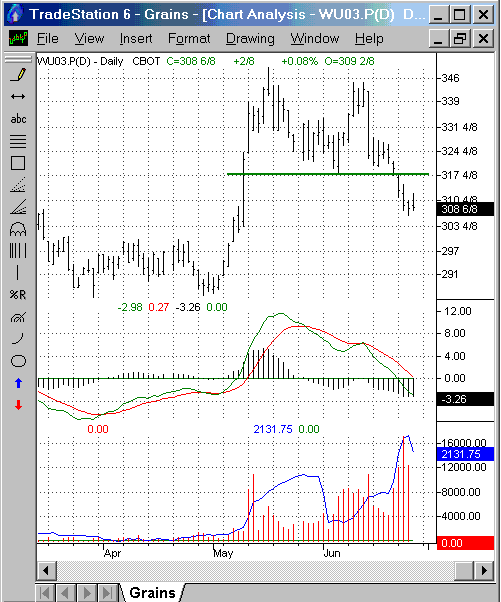
| A continued breakdown in September wheat could see these futures making a test of contract lows at 285. |
| Graphic provided by: TradeStation. |
| |
| The current correction in wheat futures can be seen as the by-product of a double top-like formation that developed in May and into June. Zooming in to look at a specific futures contract, September wheat shows the double top to have a formation size of approximately 32, as measured from the higher peak in May of 349 4/8 to the support level of 317 4/8 set by the inter-peak low in early June. If the breakdown in September wheat continues as it has, then a downside of 285 4/8 could be expected in an initial move. |
| One of the harbingers of a crashing market may be in the way the MACD indicator is moving steadily downward while the volume oscillator (shown overlaid on volume) is moving sharply upward. This appears to be what is happening in September wheat in late June. I first noticed this phenomenon with the September Swiss franc ("Head and Shoulders Tops in European Currencies," Traders.com Advantage, June 23, 2003). The chart of the Swiss franc in that article showed a falling MACD and a rising volume oscillator and anticipated a decline in the franc. Shortly after that article appeared, the Swiss franc gapped down over 80 points. Here with September wheat, the volume oscillator has just begun to round over while the MACD has dived below the zero line. |
| Grain bulls take note: another test of bottom may be in the making. The contract lows around 285 are key to both as a target for any continued breakdown in September wheat, as well as potential launching point for a rally when the breakdown is complete. |
Technical Writer for Technical Analysis of STOCKS & COMMODITIES magazine, Working-Money.com, and Traders.com Advantage.
| Title: | Technical Writer |
| Company: | Technical Analysis, Inc. |
| Address: | 4757 California Avenue SW |
| Seattle, WA 98116 | |
| Phone # for sales: | 206 938 0570 |
| Fax: | 206 938 1307 |
| Website: | www.Traders.com |
| E-mail address: | DPenn@traders.com |
Traders' Resource Links | |
| Charting the Stock Market: The Wyckoff Method -- Books | |
| Working-Money.com -- Online Trading Services | |
| Traders.com Advantage -- Online Trading Services | |
| Technical Analysis of Stocks & Commodities -- Publications and Newsletters | |
| Working Money, at Working-Money.com -- Publications and Newsletters | |
| Traders.com Advantage -- Publications and Newsletters | |
| Professional Traders Starter Kit -- Software | |
Click here for more information about our publications!
PRINT THIS ARTICLE

|

Request Information From Our Sponsors
- StockCharts.com, Inc.
- Candle Patterns
- Candlestick Charting Explained
- Intermarket Technical Analysis
- John Murphy on Chart Analysis
- John Murphy's Chart Pattern Recognition
- John Murphy's Market Message
- MurphyExplainsMarketAnalysis-Intermarket Analysis
- MurphyExplainsMarketAnalysis-Visual Analysis
- StockCharts.com
- Technical Analysis of the Financial Markets
- The Visual Investor
- VectorVest, Inc.
- Executive Premier Workshop
- One-Day Options Course
- OptionsPro
- Retirement Income Workshop
- Sure-Fire Trading Systems (VectorVest, Inc.)
- Trading as a Business Workshop
- VectorVest 7 EOD
- VectorVest 7 RealTime/IntraDay
- VectorVest AutoTester
- VectorVest Educational Services
- VectorVest OnLine
- VectorVest Options Analyzer
- VectorVest ProGraphics v6.0
- VectorVest ProTrader 7
- VectorVest RealTime Derby Tool
- VectorVest Simulator
- VectorVest Variator
- VectorVest Watchdog
