HOT TOPICS LIST
- MACD
- Fibonacci
- RSI
- Gann
- ADXR
- Stochastics
- Volume
- Triangles
- Futures
- Cycles
- Volatility
- ZIGZAG
- MESA
- Retracement
- Aroon
INDICATORS LIST
LIST OF TOPICS
PRINT THIS ARTICLE
by David Penn
A diamond bottom in corn and a developing head and shoulders bottom in wheat suggest near-term higher prices for grains.
Position: N/A
David Penn
Technical Writer for Technical Analysis of STOCKS & COMMODITIES magazine, Working-Money.com, and Traders.com Advantage.
PRINT THIS ARTICLE
HEAD & SHOULDERS
A Bottom in Grains?
02/18/03 12:31:14 PMby David Penn
A diamond bottom in corn and a developing head and shoulders bottom in wheat suggest near-term higher prices for grains.
Position: N/A
| Money manager Marc Faber has been bullish on grains for at least a year now. Yet since my December 3rd piece, "Triangle Trouble for Wheat Futures" (Traders.com Advantage, December 3, 2002)--and even earlier in my "December Corn's 2B Test of Top" (Traders.com Advantage, September 13, 2002)--I have found it difficult to concur with the market observations of a man with whom I otherwise quite frequently concur. But the opportunity for a convergence of opinions may be at hand. Having suggested last fall and winter that the grains--as represented by wheat and corn--were topping, there is growing evidence that the grains--again, as represented by wheat and corn--have bottomed and are due for a signficant rally, at least in the near-term. |
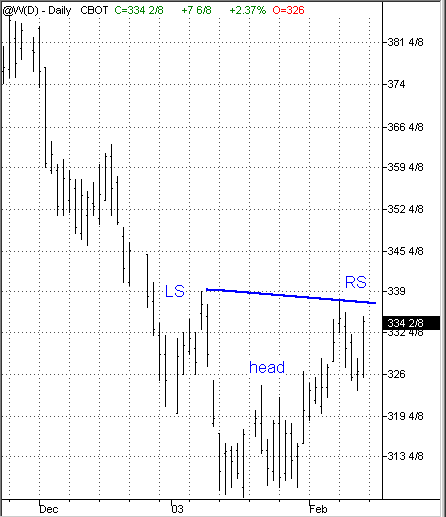
| Let's look first at wheat. Wheat topped in September 2002 at about 443 (basis continuous futures). From that time until January 2003, wheat prices fell some 30% to 307. However, it appears that the last month of this decline--December--was part of a basing pattern from which wheat futures appear to be emerging in February. That basing pattern increasingly looks as if it is taking the form of a head and shoulders bottom, as the chart below suggests: |

|
| Figure 1: This developing head and shoulders bottom suggests higher near-term prices in wheat futures. |
| Graphic provided by: TradeStation. |
| |
| As the chart shows, the left shoulder consists of the price action in the first week of January 2003, the head of the formation spans from mid-January to mid-February, and the right shoulder appears to be developing over the balance of the month. Although the left shoulder of this potential head and shoulders bottom reaches down as far as 319, support for the right shoulder seems to be a bit higher. That said, while a break to 319 at this point would not invalidate the formation's bullish portents, it would be a negative sign given that such a break would likely violate an uptrend line that could be drawn from the lows of late January to the current lows of February. Should this head and shoulders bottom in wheat experience an upside breakout then, given the size of the formation, an advance to the 371 area should be expected. |
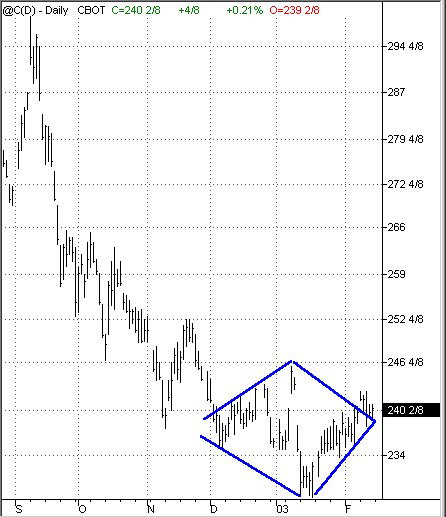
| Corn futures also topped in September 2002. From a high of 299 (basis continuous futures), corn futures fell almost 24% over the next four months before bottoming just north of 228. Interestingly, it appears as if corn futures actually began basing and consolidating in December--one month before prices reached a nominal bottom. This basing process, with its spike upward in early January followed almost immediately by a spike downward, looks to have taken the form of a diamond bottom formation, as the chart below implies: |
 Figure 2: A diamond bottom looks to end and reverse the bearish trend in corn futures. Diamond bottoms are reversal formations when they appear at the end of trends, and tend to experience their breakouts not at the top of the formation, but at or near the point on the right side of the pattern where the top and bottom lines converge. This breakout point often serves as a point of support in the event of an upside breakout. When pullbacks occur after such breakouts, then this area can be used as a sort of tentative "make or break" point for the resumed uptrend suggested by the breakout. What sort of upside could be expected from a successful breakout from this diamond bottom? Given a formation size of about 18 and a breakout point of about 240, an upside minimum of 258 is likely. This would mean a taking out of the November 2002 highs and, perhaps, a challenge of the October highs in corn futures, as well. |
Technical Writer for Technical Analysis of STOCKS & COMMODITIES magazine, Working-Money.com, and Traders.com Advantage.
| Title: | Technical Writer |
| Company: | Technical Analysis, Inc. |
| Address: | 4757 California Avenue SW |
| Seattle, WA 98116 | |
| Phone # for sales: | 206 938 0570 |
| Fax: | 206 938 1307 |
| Website: | www.Traders.com |
| E-mail address: | DPenn@traders.com |
Traders' Resource Links | |
| Charting the Stock Market: The Wyckoff Method -- Books | |
| Working-Money.com -- Online Trading Services | |
| Traders.com Advantage -- Online Trading Services | |
| Technical Analysis of Stocks & Commodities -- Publications and Newsletters | |
| Working Money, at Working-Money.com -- Publications and Newsletters | |
| Traders.com Advantage -- Publications and Newsletters | |
| Professional Traders Starter Kit -- Software | |
Click here for more information about our publications!
PRINT THIS ARTICLE

Request Information From Our Sponsors
- StockCharts.com, Inc.
- Candle Patterns
- Candlestick Charting Explained
- Intermarket Technical Analysis
- John Murphy on Chart Analysis
- John Murphy's Chart Pattern Recognition
- John Murphy's Market Message
- MurphyExplainsMarketAnalysis-Intermarket Analysis
- MurphyExplainsMarketAnalysis-Visual Analysis
- StockCharts.com
- Technical Analysis of the Financial Markets
- The Visual Investor
- VectorVest, Inc.
- Executive Premier Workshop
- One-Day Options Course
- OptionsPro
- Retirement Income Workshop
- Sure-Fire Trading Systems (VectorVest, Inc.)
- Trading as a Business Workshop
- VectorVest 7 EOD
- VectorVest 7 RealTime/IntraDay
- VectorVest AutoTester
- VectorVest Educational Services
- VectorVest OnLine
- VectorVest Options Analyzer
- VectorVest ProGraphics v6.0
- VectorVest ProTrader 7
- VectorVest RealTime Derby Tool
- VectorVest Simulator
- VectorVest Variator
- VectorVest Watchdog
