HOT TOPICS LIST
- MACD
- Fibonacci
- RSI
- Gann
- ADXR
- Stochastics
- Volume
- Triangles
- Futures
- Cycles
- Volatility
- ZIGZAG
- MESA
- Retracement
- Aroon
INDICATORS LIST
LIST OF TOPICS
PRINT THIS ARTICLE
by David Penn
The triangle in the gold bugs index ($HUI) is the best thing going for gold bulls. But the index's bearish divergence with the MACD--along with a declining gold price--give plenty of pause for thought.
Position: N/A
David Penn
Technical Writer for Technical Analysis of STOCKS & COMMODITIES magazine, Working-Money.com, and Traders.com Advantage.
PRINT THIS ARTICLE
TRIANGLES
The Gold Bug and the Ascending Triangle
06/27/03 11:37:26 AMby David Penn
The triangle in the gold bugs index ($HUI) is the best thing going for gold bulls. But the index's bearish divergence with the MACD--along with a declining gold price--give plenty of pause for thought.
Position: N/A
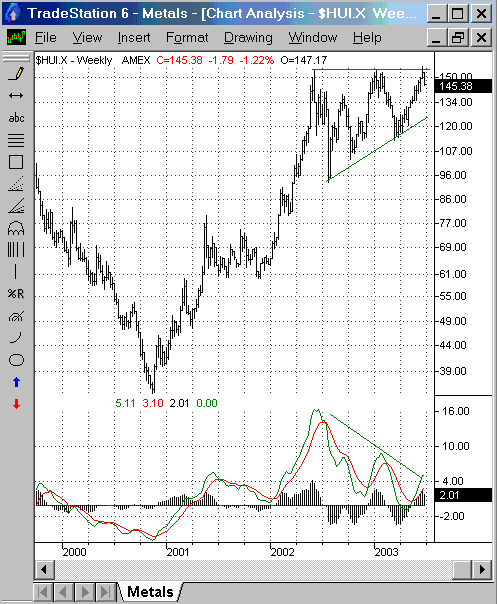
| The move up in gold shares over the past two years has been a phenomenal boon to that much-maligned group of investors known as gold bugs. Their halcyon days some twenty years gone, gold bugs have had little to cheer about during most of the secular bull market in stocks just ended. But all that changed in the fall of 2000. The $HUI, which is an index of unhedged (no short sales against production or inventories) gold mining companies, bottomed in October 2000 around 35 and have quadrupled in the years since. |
| Beginning in 2002, however, the $HUI entered a triangle shaped consolidation with a flat, horizontal resistance level at approximately 150 and a series of higher lows in July 2002 at 93, October 2002 at 103, and March 2003 at 113. Given the run-up in prices that preceded this consolidation, it appears as if $HUI is developing an ascending triangle, a widely-recognized bullish continuation chart pattern. Should this chart pattern turn out to be valid, then a breakout above 150 should take the $HUI as high as 207 in an initial, move up. Such a level would be comparable to highs not seen in the $HUI since 1996. |

|
| Do the lower highs in the MACD anticipate merely a pullback in the $HUI before breakout, or a breakout that will fail? |
| Graphic provided by: TradeStation. |
| |
| This bullish outlook on gold stocks is complicated somewhat by a bearish look on gold, at least in the near-term. As I suggested in an article several days ago ("Has the Gold Bough Been Broken?", Traders.com Advantage, June 16, 2003.), there was ample evidence that the most recent uptrend in gold, the uptrend that began in early April, was peaking. A dramatic fall-off in buying interest, an MACD that was rounding over after a two-month advance, and a sharp trendline break to the downside are all factors that contribute to this bearish outlook on gold. |
| But even within the $HUI itself there are bearish portents. The most apparent one right now is the way the MACD of $HUI has been making lower highs at the same time that prices have been making higher lows. Generally speaking, this is a classic negative (bearish) divergence. |
| I can see two possible resolutions to this divergence between price action and the MACD. The bullish scenario suggests that the lower highs in the MACD are anticipating a fall in the $HUI back to the lower, upwardly sloping support trendline. If the bull market in unhedged gold shares is to continue, then a brief dip below the MACD's zero line could be followed by a rally from this relatively "oversold" position. The bearish scenario, however, has the lower highs in the MACD anticipating a failed breakout in the $HUI, arguably turning this ascending triangle into a bearish, triple top-like reversal formation. A breakdown from such a chart pattern would also move the $HUI by some 57-odd points -- but in the opposite direction. In fact, such a breakdown could take the $HUI down to the mid-30s -- virtually erasing the entirety of the bull market advance that began in the fall of 2000. |
Technical Writer for Technical Analysis of STOCKS & COMMODITIES magazine, Working-Money.com, and Traders.com Advantage.
| Title: | Technical Writer |
| Company: | Technical Analysis, Inc. |
| Address: | 4757 California Avenue SW |
| Seattle, WA 98116 | |
| Phone # for sales: | 206 938 0570 |
| Fax: | 206 938 1307 |
| Website: | www.Traders.com |
| E-mail address: | DPenn@traders.com |
Traders' Resource Links | |
| Charting the Stock Market: The Wyckoff Method -- Books | |
| Working-Money.com -- Online Trading Services | |
| Traders.com Advantage -- Online Trading Services | |
| Technical Analysis of Stocks & Commodities -- Publications and Newsletters | |
| Working Money, at Working-Money.com -- Publications and Newsletters | |
| Traders.com Advantage -- Publications and Newsletters | |
| Professional Traders Starter Kit -- Software | |
Click here for more information about our publications!
Comments
Date: 07/01/03Rank: 5Comment:

Request Information From Our Sponsors
- VectorVest, Inc.
- Executive Premier Workshop
- One-Day Options Course
- OptionsPro
- Retirement Income Workshop
- Sure-Fire Trading Systems (VectorVest, Inc.)
- Trading as a Business Workshop
- VectorVest 7 EOD
- VectorVest 7 RealTime/IntraDay
- VectorVest AutoTester
- VectorVest Educational Services
- VectorVest OnLine
- VectorVest Options Analyzer
- VectorVest ProGraphics v6.0
- VectorVest ProTrader 7
- VectorVest RealTime Derby Tool
- VectorVest Simulator
- VectorVest Variator
- VectorVest Watchdog
- StockCharts.com, Inc.
- Candle Patterns
- Candlestick Charting Explained
- Intermarket Technical Analysis
- John Murphy on Chart Analysis
- John Murphy's Chart Pattern Recognition
- John Murphy's Market Message
- MurphyExplainsMarketAnalysis-Intermarket Analysis
- MurphyExplainsMarketAnalysis-Visual Analysis
- StockCharts.com
- Technical Analysis of the Financial Markets
- The Visual Investor
