HOT TOPICS LIST
- MACD
- Fibonacci
- RSI
- Gann
- ADXR
- Stochastics
- Volume
- Triangles
- Futures
- Cycles
- Volatility
- ZIGZAG
- MESA
- Retracement
- Aroon
INDICATORS LIST
LIST OF TOPICS
PRINT THIS ARTICLE
by David Penn
As gold stocks soar toward resistance, gold futures appear to have topped out for the time being.
Position: N/A
David Penn
Technical Writer for Technical Analysis of STOCKS & COMMODITIES magazine, Working-Money.com, and Traders.com Advantage.
PRINT THIS ARTICLE
REVERSAL
Has the Gold Bough Been Broken?
06/16/03 10:31:20 AMby David Penn
As gold stocks soar toward resistance, gold futures appear to have topped out for the time being.
Position: N/A
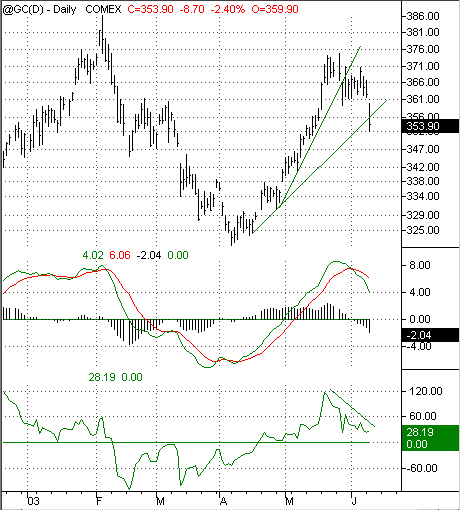
| To add to the strange convergences and divergences in the markets these days (see my "The Reflation Trade", Working-Money.com, June 11, 2003), consider that as stocks of gold mining companies moved higher and higher, approaching a major test of highs not seen since 1997, prices for gold futures--which had also been rising in 2003--appear to have begun dropping precipitously. Gold (basis continuous futures) appeared to top out in late May, at a time when both the stock market and the market for long-term Treasuries were at similarly advanced stages in their respective rallies. However, as the stock market continued to move up in June and Treasuries--albeit haltingly--followed suit, gold appeared to run into "overhead supply" north of 370. |
 Figure 1: The Herrick Payoff Index began declining in mid-May, and the MACD began rounding over soon after. But the trendline break in June looms as a potentially decisive factor in any upcoming correction in gold. The pair of technical indicators provided also corroborate the likely correction in gold. The moving average convergence-divergence indicator here functions as an overbought/oversold indicator, and the fact that it appears to be rounding over and headed downward in sync with gold prices is strongly suggestive of lower prices going forward. Even earlier than the signal in the MACD was the movement in the Herrick Payoff Index(HPI) which measures volume flowing into and out of futures contracts. Here, the declining HPI since mid-May helps explain (if not anticipate to a degree) the break from gold's brief consolidation between 376 and 360. |

|
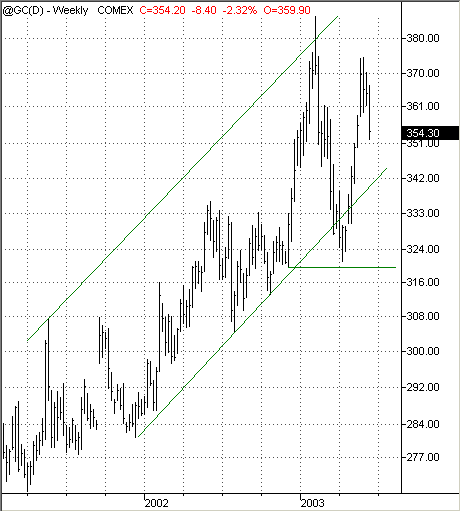
| Figure 2. For the most part, gold's advance has stayed within a trend channel. Will any correction cause gold to move beyond the support provided along the lows? |
| Graphic provided by: TradeStation. |
| |
| Seen in the broader context of the rally in gold futures since early in 2001, the current correction in gold is perhaps even easier to understand. Given the lack of buying interest in the upper 370s, gold futures have begun moving down toward the lower end of a trend channel that has largely encapsulated the advance in the price of gold for at least the past two and a half years. Although gold has briefly penetrated the channel on both the up and downsides, it is reasonable to expect the current gold correction to find support on or around the lower end of the current trend channel, perhaps in the low 340s. Failing to find support here, gold futures might retreat as low as 323, the trough low of the previous correction. A break below this point, it almost goes without saying, could be catastrophic for those on the long side of gold. A basic swing rule measurement of the price action in gold futures since 2003--including a peak of 385 and a "swing" level of 320--suggests that if gold breaks beneath 320, an ultimate decline to 255 should not be casually dismissed. |
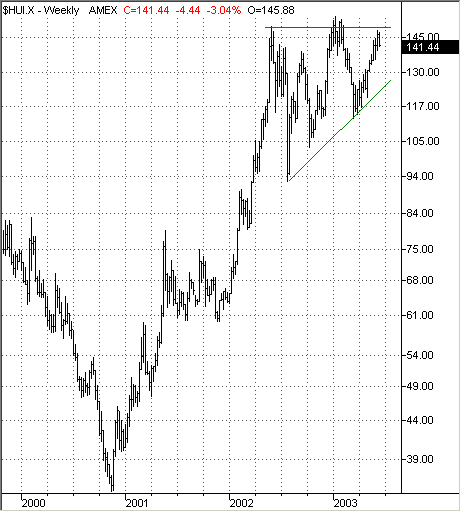
 Figure 3: On a tear since the fourth quarter of 2000, unhedged gold stocks test the $HUI's six year highs north of 145. These variously bearish projections for the price of gold, however, seem odd when compared to the conventional wisdom (and technical picture) for gold shares. As Figure 3 illustrates, while gold shares (as measured by the $HUI, basket of unhedged gold stocks) have been in a major bull market since the fall of 2000, they have been in an ascending triangle type of formation near the highs for more than a year. The sloping, uptrend support line combined with a nearly flat horizontal resistance line is a fairly convincing case for a move higher and, here, appears to be an almost textbook example of an ascending triangle. However, could gold futures move down significantly (as they appear poised to do), while shares of gold mining companies advance significantly? |
| While this may continue to represent the $64,000 question for gold bugs, a comparison of the weekly charts of continuous gold futures and the $HUI may point to some clues. It appears as if the price of gold has led gold shares higher over the past year by as much as six months. Gold bottomed in early 2000, gold shares bottomed late in 2000. Gold entered a penultimate consolidation (a triangle, importantly) before moving up toward its final peak in the second quarter of 2002. Gold shares (as represented by $HUI) entered a larger-ranging triangle shaped consolidation shortly thereafter. While gold appears to have broken out of its consolidation in 2003, corrected, and rallied to a new, lower top, gold shares have yet to break from the triangle consolidation they developed at the same time as did the price of gold. |
Technical Writer for Technical Analysis of STOCKS & COMMODITIES magazine, Working-Money.com, and Traders.com Advantage.
| Title: | Technical Writer |
| Company: | Technical Analysis, Inc. |
| Address: | 4757 California Avenue SW |
| Seattle, WA 98116 | |
| Phone # for sales: | 206 938 0570 |
| Fax: | 206 938 1307 |
| Website: | www.Traders.com |
| E-mail address: | DPenn@traders.com |
Traders' Resource Links | |
| Charting the Stock Market: The Wyckoff Method -- Books | |
| Working-Money.com -- Online Trading Services | |
| Traders.com Advantage -- Online Trading Services | |
| Technical Analysis of Stocks & Commodities -- Publications and Newsletters | |
| Working Money, at Working-Money.com -- Publications and Newsletters | |
| Traders.com Advantage -- Publications and Newsletters | |
| Professional Traders Starter Kit -- Software | |
Click here for more information about our publications!
Comments

Request Information From Our Sponsors
- StockCharts.com, Inc.
- Candle Patterns
- Candlestick Charting Explained
- Intermarket Technical Analysis
- John Murphy on Chart Analysis
- John Murphy's Chart Pattern Recognition
- John Murphy's Market Message
- MurphyExplainsMarketAnalysis-Intermarket Analysis
- MurphyExplainsMarketAnalysis-Visual Analysis
- StockCharts.com
- Technical Analysis of the Financial Markets
- The Visual Investor
- VectorVest, Inc.
- Executive Premier Workshop
- One-Day Options Course
- OptionsPro
- Retirement Income Workshop
- Sure-Fire Trading Systems (VectorVest, Inc.)
- Trading as a Business Workshop
- VectorVest 7 EOD
- VectorVest 7 RealTime/IntraDay
- VectorVest AutoTester
- VectorVest Educational Services
- VectorVest OnLine
- VectorVest Options Analyzer
- VectorVest ProGraphics v6.0
- VectorVest ProTrader 7
- VectorVest RealTime Derby Tool
- VectorVest Simulator
- VectorVest Variator
- VectorVest Watchdog
