HOT TOPICS LIST
- MACD
- Fibonacci
- RSI
- Gann
- ADXR
- Stochastics
- Volume
- Triangles
- Futures
- Cycles
- Volatility
- ZIGZAG
- MESA
- Retracement
- Aroon
INDICATORS LIST
LIST OF TOPICS
PRINT THIS ARTICLE
by David Penn
With the world tilted toward expectations of a lower dollar, this trend reversal strategy will help tell a mere bounce from a real reversal in the greenback's fortunes.
Position: N/A
David Penn
Technical Writer for Technical Analysis of STOCKS & COMMODITIES magazine, Working-Money.com, and Traders.com Advantage.
PRINT THIS ARTICLE
REVERSAL
The September Greenback's 1-2-3 Reversal?
06/26/03 02:16:54 PMby David Penn
With the world tilted toward expectations of a lower dollar, this trend reversal strategy will help tell a mere bounce from a real reversal in the greenback's fortunes.
Position: N/A
| There are two contradictory notions in technical analysis. The more clever and nuanced of these notions is the idea that when everyone is betting on a certain outcome, there is a likelihood that the exact opposite of that outcome will occur. Whether you believe this is a result of Heisenberg's uncertainty principle, or simply the more cynical canard that most things that are widely believed in and about the financial markets are wrong, this point of view is part of the foundation of contrarian approaches to market analysis. |
| Of course, the contrary to this notion is that things that go up tend to keep going up. And things that are going down tend to continue going down. |

|
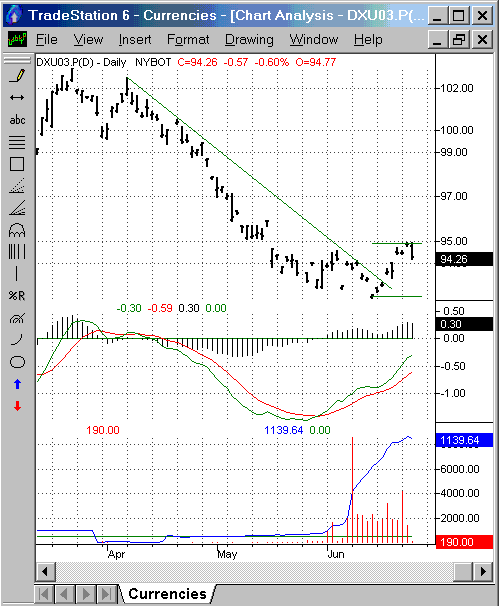
| A test of the lows looms for the September greenback index. |
| Graphic provided by: TradeStation. |
| |
| I think of this conundrum when looking at a chart of the September U.S. Dollar Index futures contract. The U.S. Dollar Index has been in a dedicated downtrend since the summer of 2001 when it topped out at about 125. It is important to remember that the rally that brought the $USD to these heights was itself a corrective, counter-trend rally that emerged in 1995 in the wake of the dollar's fall from even higher heights in 1987 (the U.S. Dollar Index was at about 165). In other words, the greenback was at 165 in 1987, fell to a low of 80 in 1995, and then rallied to a peak of 125 in 2001. |
| Currently trading in the low-to-mid 90s, the dollar index has been in a two month consolidation range. Most recently in June, the dollar index has moved up beyond both its June highs as well as a downtrend line that begins in early April. This development is reason enough to consider whether or not the dollar will establish a bottom here, or whether this trendline break to the upside is mostly a "relief rally" before a resumption of the trend downward. |
| Given the trendline break, one of the tools that may be helpful is the 1-2-3 trend reversal introduced by Victor Sperandeo (Trader Vic--Methods of a Wall Street Master). The 1-2-3 trend reversal involves an initial trendline break (1), a test of the lows (or highs) of the previous trend (2), and, if the reversal is valid, a strong move counter to the previous trend, preferably taking out a signficant minor high or low in the process (3). For example, consider the September U.S. dollar index contract. The (1) in the methodology comes with the trendline break to the upside in early June. What is necessary now is that prices move back down to test the low at 92.5, which would mark the (2) of the 1-2-3 trend reversal. A successful test of the lows here would set the stage for a rally, with the June highs likely to be the first target to be taken out as part (3). |
Technical Writer for Technical Analysis of STOCKS & COMMODITIES magazine, Working-Money.com, and Traders.com Advantage.
| Title: | Technical Writer |
| Company: | Technical Analysis, Inc. |
| Address: | 4757 California Avenue SW |
| Seattle, WA 98116 | |
| Phone # for sales: | 206 938 0570 |
| Fax: | 206 938 1307 |
| Website: | www.Traders.com |
| E-mail address: | DPenn@traders.com |
Traders' Resource Links | |
| Charting the Stock Market: The Wyckoff Method -- Books | |
| Working-Money.com -- Online Trading Services | |
| Traders.com Advantage -- Online Trading Services | |
| Technical Analysis of Stocks & Commodities -- Publications and Newsletters | |
| Working Money, at Working-Money.com -- Publications and Newsletters | |
| Traders.com Advantage -- Publications and Newsletters | |
| Professional Traders Starter Kit -- Software | |
Click here for more information about our publications!
Comments

Request Information From Our Sponsors
- StockCharts.com, Inc.
- Candle Patterns
- Candlestick Charting Explained
- Intermarket Technical Analysis
- John Murphy on Chart Analysis
- John Murphy's Chart Pattern Recognition
- John Murphy's Market Message
- MurphyExplainsMarketAnalysis-Intermarket Analysis
- MurphyExplainsMarketAnalysis-Visual Analysis
- StockCharts.com
- Technical Analysis of the Financial Markets
- The Visual Investor
- VectorVest, Inc.
- Executive Premier Workshop
- One-Day Options Course
- OptionsPro
- Retirement Income Workshop
- Sure-Fire Trading Systems (VectorVest, Inc.)
- Trading as a Business Workshop
- VectorVest 7 EOD
- VectorVest 7 RealTime/IntraDay
- VectorVest AutoTester
- VectorVest Educational Services
- VectorVest OnLine
- VectorVest Options Analyzer
- VectorVest ProGraphics v6.0
- VectorVest ProTrader 7
- VectorVest RealTime Derby Tool
- VectorVest Simulator
- VectorVest Variator
- VectorVest Watchdog
