HOT TOPICS LIST
- MACD
- Fibonacci
- RSI
- Gann
- ADXR
- Stochastics
- Volume
- Triangles
- Futures
- Cycles
- Volatility
- ZIGZAG
- MESA
- Retracement
- Aroon
INDICATORS LIST
LIST OF TOPICS
PRINT THIS ARTICLE
by David Penn
Six-week trendline breaks to the downside and volume oscillators turning lower are among the factors that contribute to a bearish outlook on the energies.
Position: N/A
David Penn
Technical Writer for Technical Analysis of STOCKS & COMMODITIES magazine, Working-Money.com, and Traders.com Advantage.
PRINT THIS ARTICLE
VOLUME OSCILLATOR
Have the Energies Had Enough?
06/24/03 01:23:26 PMby David Penn
Six-week trendline breaks to the downside and volume oscillators turning lower are among the factors that contribute to a bearish outlook on the energies.
Position: N/A
| The bull markets in the energies group, a group that includes crude oil, heating oil, natural gas and unleaded gasoline, appear to have ended in March 2003. The final uplegs in these bull markets began with the fall 2003 lows, and saw these commodities make some impressive gains. Basis September, for example, unleaded gas broke out at 7500 and rallied strongly before topping near 9360. Heating oil broke out at 6875 and topped out near 8620. Crude oil broke out at about 25 and topped just north of 31. Natural gas, which actually made a higher high in early June and is the one energy that has not broken its uptrend line to any major degree, broke out above 4, reached 6 in late February and 6.5 in early June. |
| Those are the sort of gains that made trend traders swoon with delight. But those who missed riding the energies on the way up may be able to profit from those same energies on the way down. Although the rally in natural gas remains resilient (though downside risks are increasing, see my "Is It 'Now Time' for Natural Gas?", Traders.com Advantage, June 19, 2003), the three other members of the energies group are showing real signs of technical weakness. That this weakness comes as crude, heating oil and unleaded gasoline are making lower secondary peaks vis-a-vis the spring highs only underscores the likelihood of bear markets taking over these commodities. |

|
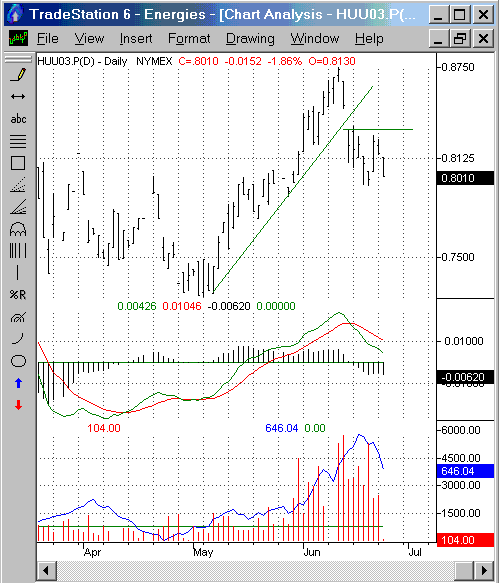
| A bearish gap down in mid-June anticipated a swift reversal in the volume oscillator to the downside. |
| Graphic provided by: TradeStation. |
| |
| The weakest of the group appears to be unleaded gasoline. Like heating oil, unleaded gasoline gapped down beneath a six week up trendline that represented a bounce from the correction in the spring that ended the bull markets in gasoline, crude and heating oil. This alone is evidence of significant technical weakness. However, whereas heating oil has managed to test this trendline for resistance, unleaded gasoline has remained beneath the high of its gap down day. |
| The peak and turning-down of the moving average convergence-divergence indicator is another bearish development in September unleaded gasoline. Although a convergence between the two moving averages is likely as a result of the brief consolidation in unleaded gas in the second half of June, the next technical event for the indicator appears to be a test of the zero line. Such a test would also likely come as a result of a breakdown in unleaded gas, most probably below the consolidation lows of 7950. |
| Contributing to the chorus of bearish indicators is the volume oscillator, shown in blue and overlaid on volume. The volume oscillator, which measures the difference between two moving averages of volume, also spiked shortly after the June top. The rolling over of the volume oscillator suggests strongly that the rally is running out of steam and that a correction is increasingly possible. |
Technical Writer for Technical Analysis of STOCKS & COMMODITIES magazine, Working-Money.com, and Traders.com Advantage.
| Title: | Technical Writer |
| Company: | Technical Analysis, Inc. |
| Address: | 4757 California Avenue SW |
| Seattle, WA 98116 | |
| Phone # for sales: | 206 938 0570 |
| Fax: | 206 938 1307 |
| Website: | www.Traders.com |
| E-mail address: | DPenn@traders.com |
Traders' Resource Links | |
| Charting the Stock Market: The Wyckoff Method -- Books | |
| Working-Money.com -- Online Trading Services | |
| Traders.com Advantage -- Online Trading Services | |
| Technical Analysis of Stocks & Commodities -- Publications and Newsletters | |
| Working Money, at Working-Money.com -- Publications and Newsletters | |
| Traders.com Advantage -- Publications and Newsletters | |
| Professional Traders Starter Kit -- Software | |
Click here for more information about our publications!
PRINT THIS ARTICLE

Request Information From Our Sponsors
- StockCharts.com, Inc.
- Candle Patterns
- Candlestick Charting Explained
- Intermarket Technical Analysis
- John Murphy on Chart Analysis
- John Murphy's Chart Pattern Recognition
- John Murphy's Market Message
- MurphyExplainsMarketAnalysis-Intermarket Analysis
- MurphyExplainsMarketAnalysis-Visual Analysis
- StockCharts.com
- Technical Analysis of the Financial Markets
- The Visual Investor
- VectorVest, Inc.
- Executive Premier Workshop
- One-Day Options Course
- OptionsPro
- Retirement Income Workshop
- Sure-Fire Trading Systems (VectorVest, Inc.)
- Trading as a Business Workshop
- VectorVest 7 EOD
- VectorVest 7 RealTime/IntraDay
- VectorVest AutoTester
- VectorVest Educational Services
- VectorVest OnLine
- VectorVest Options Analyzer
- VectorVest ProGraphics v6.0
- VectorVest ProTrader 7
- VectorVest RealTime Derby Tool
- VectorVest Simulator
- VectorVest Variator
- VectorVest Watchdog
