HOT TOPICS LIST
- MACD
- Fibonacci
- RSI
- Gann
- ADXR
- Stochastics
- Volume
- Triangles
- Futures
- Cycles
- Volatility
- ZIGZAG
- MESA
- Retracement
- Aroon
INDICATORS LIST
LIST OF TOPICS
PRINT THIS ARTICLE
by Koos van der Merwe
Following up on my Nasdaq chart of the June 10th, where I suggested that the Nasdaq does look bullish, but with nothing cast in stone, here is a chart and analysis of the S&P500 index.
Position: Hold
Koos van der Merwe
Has been a technical analyst since 1969, and has worked as a futures and options trader with First Financial Futures in Johannesburg, South Africa.
PRINT THIS ARTICLE
ELLIOTT WAVE
The S&P 500 Weekly Chart
06/23/03 01:10:54 PMby Koos van der Merwe
Following up on my Nasdaq chart of the June 10th, where I suggested that the Nasdaq does look bullish, but with nothing cast in stone, here is a chart and analysis of the S&P500 index.
Position: Hold
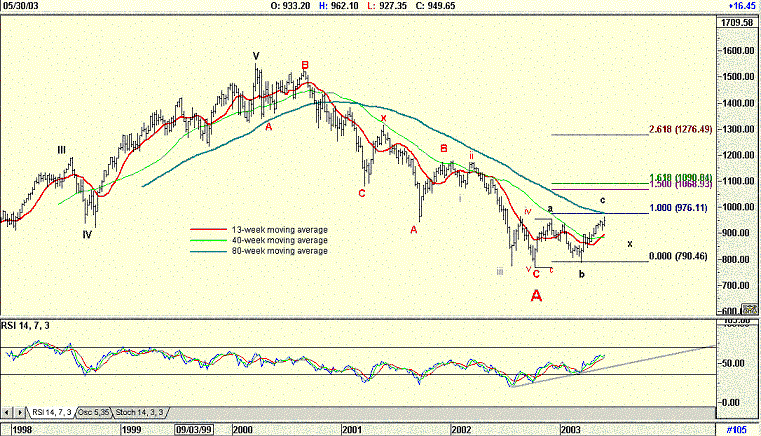
| The chart is fairly straightforward and self explanatory. What is pleasant is that the Elliott Wave count is simple, and follows the first rule of Elliott, viz. IT MUST LOOK RIGHT. To recap: The chart is a bar chart with three moving averages superimposed. a. The 13-week moving average was chosen because it is a popular smoothing average, and is also one of my favorites. b. The 40-week moving average is the 200-day moving average, a stalwart of Technical Analysis. c. The 80-week moving average, which appeared to act as a support level to the index on the way up, could be a strong resistance level in the very near future. |
| The Elliott wave count suggests that the high on March 24th 2000 was indeed a 5th wave top, and that the down move followed the abcxabc pattern rather than the more formal A, B, 12345 C pattern, which would occur at the end of a bear market. This does suggest that the correction down is probably a major wave A which can be fortified by the wave not ending with the fourth wave of lesser degree, (III - IV of the rise up) but exceeded it. I am therefore forced to believe that the S&P500 index is now in a B-Wave upwards, that should follow an abcxabc pattern. I have drawn in fibonocci extensions taken from the rise of 'C' to 'a' which does suggest 1068.93 as a possible 50% target, but B-waves are difficult to predict, and I have known them to exceed the high point of previous wave V's. |

|
| S&P 500 Index and Elliott Wave analysis. |
| Graphic provided by: AdvancedGET. |
| |
| Finally, to be a little bit confusing, do remember that every Elliottician has an alternative strategy in a back pocket. Mine is that the drop to 767.96 in October 2002 was indeed the end of the Bear market, and that the rise since that date can truly be a 5-wave upward impulse wave, with wave 'a' on the chart being wave 1, 'b' on the chart as wave 2 with wave 3 now in progress and a possible target at the 1.618 level shown by the Fibonocci extension of 1090.84. To achieve this, the index will firstly have to overcome the strong resistance level of the 80 week moving average. With fundamentalists calling the market overvalued, and putting the fear of God into investors, the barrier may be formidable indeed. |
| And do not forget the RSI indicator, which is strongly bullish |
| To conclude then, if the S&P is in a B-Wave upwards, you can now expect an strong correction to retest the 13-week moving average at the level marked 'x', (approx 50% retracement) on the chart. On the other hand, if the S&P is in an impulse wave upward, then we should see a small correction as it approaches the 80-week MA, with a strong rise to 1090 once it has broken through. |
Has been a technical analyst since 1969, and has worked as a futures and options trader with First Financial Futures in Johannesburg, South Africa.
| Address: | 3256 West 24th Ave |
| Vancouver, BC | |
| Phone # for sales: | 6042634214 |
| E-mail address: | petroosp@gmail.com |
Click here for more information about our publications!
Comments
Date: 06/26/03Rank: 2Comment:

Request Information From Our Sponsors
- StockCharts.com, Inc.
- Candle Patterns
- Candlestick Charting Explained
- Intermarket Technical Analysis
- John Murphy on Chart Analysis
- John Murphy's Chart Pattern Recognition
- John Murphy's Market Message
- MurphyExplainsMarketAnalysis-Intermarket Analysis
- MurphyExplainsMarketAnalysis-Visual Analysis
- StockCharts.com
- Technical Analysis of the Financial Markets
- The Visual Investor
- VectorVest, Inc.
- Executive Premier Workshop
- One-Day Options Course
- OptionsPro
- Retirement Income Workshop
- Sure-Fire Trading Systems (VectorVest, Inc.)
- Trading as a Business Workshop
- VectorVest 7 EOD
- VectorVest 7 RealTime/IntraDay
- VectorVest AutoTester
- VectorVest Educational Services
- VectorVest OnLine
- VectorVest Options Analyzer
- VectorVest ProGraphics v6.0
- VectorVest ProTrader 7
- VectorVest RealTime Derby Tool
- VectorVest Simulator
- VectorVest Variator
- VectorVest Watchdog
