HOT TOPICS LIST
- MACD
- Fibonacci
- RSI
- Gann
- ADXR
- Stochastics
- Volume
- Triangles
- Futures
- Cycles
- Volatility
- ZIGZAG
- MESA
- Retracement
- Aroon
INDICATORS LIST
LIST OF TOPICS
PRINT THIS ARTICLE
by Arthur Hill
The Dow Industrials closed above its prior high (8522) earlier this month to finally confirm the Dow Transports. However, another new high by the Dow Transports leaves more questions unanswered and, more importantly, a larger non-confirmation lingering.
Position: N/A
Arthur Hill
Arthur Hill is currently editor of TDTrader.com, a website specializing in trading strategies, sector/industry specific breadth stats and overall technical analysis. He passed the Society of Technical Analysts (STA London) diploma exam with distinction is a Certified Financial Technician (CFTe). Prior to TD Trader, he was the Chief Technical Analyst for Stockcharts.com and the main contributor to the ChartSchool.
PRINT THIS ARTICLE
DOW THEORY
Dow Theory Revisited
05/29/03 09:01:49 AMby Arthur Hill
The Dow Industrials closed above its prior high (8522) earlier this month to finally confirm the Dow Transports. However, another new high by the Dow Transports leaves more questions unanswered and, more importantly, a larger non-confirmation lingering.
Position: N/A
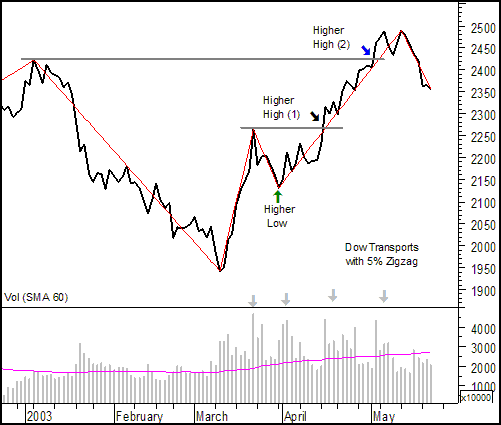
| After the March advance, the Dow Industrials and Dow Transports both formed higher lows on 31-Mar (green arrows). The Dow transports wasted little time and moved above its prior reaction high two weeks later (15-May). Conversely, the Dow Industrials dilly dallied around and did not exceed its prior reaction high until 2-May, a full two weeks after the Dow Transports. Technically, the Dow Theory confirmation occurred, but the lag time sows the seeds of doubt. To recap, the Dow Theory is built on the assumption that the Dow Industrials and Dow Transports confirm one another to produce signals. A Dow Theory buy signal occurs when both the Dow Industrials and Dow Transports hold above their prior reaction lows AND move above their prior reaction highs. Conversely, a Dow Theory sell signal occurs when both the Dow Industrials and Dow Transports hold below their prior reaction highs AND move below their prior reaction lows. Closing prices should be used and a non-confirmation occurs when only one average produces a valid trend change. |
| Returning to those seeds of doubt, the Dow Transports extended their advance with a move above the January high on 2-May (blue arrow). While the Dow was simply bettering its March high, the Dow Transports was already raising the ante. The Dow Transports has since pulled back from this reaction high, but the Dow did not even come close to its January high (8843). This has created another non-confirmation as the Dow Industrials continue to lag the Dow Transports. |

|
| Figure 1: Dow Industrials. |
| Graphic provided by: MetaStock. |
| |
 Figure 2: Dow Transports. In addition to lagging on price action, the Dow Industrials is also lagging on volume. Each advance and breakout for the Dow Transports featured a surge in volume with levels well above average. With the exception of a recent pop on 21-May, Dow volume has steadily declined as the average advanced. The whole May advance (1-May to 19-May) occurred on below average volume. This calls into question the validity of the advance and the recent breakout. |
| Charting Note: In order to weed out the minor moves, the zigzag indicator (thin red line) was applied to both averages, and price movements of at least 5% were used to identify reaction highs and lows. A 5% minimum is good for medium-term trends. For long-term trends, a 10% minimum move may be more suitable. |
Arthur Hill is currently editor of TDTrader.com, a website specializing in trading strategies, sector/industry specific breadth stats and overall technical analysis. He passed the Society of Technical Analysts (STA London) diploma exam with distinction is a Certified Financial Technician (CFTe). Prior to TD Trader, he was the Chief Technical Analyst for Stockcharts.com and the main contributor to the ChartSchool.
| Title: | Editor |
| Company: | TDTrader.com |
| Address: | Willem Geetsstraat 17 |
| Mechelen, B2800 | |
| Phone # for sales: | 3215345465 |
| Website: | www.tdtrader.com |
| E-mail address: | arthurh@tdtrader.com |
Traders' Resource Links | |
| TDTrader.com has not added any product or service information to TRADERS' RESOURCE. | |
Click here for more information about our publications!
Comments

|

Request Information From Our Sponsors
- StockCharts.com, Inc.
- Candle Patterns
- Candlestick Charting Explained
- Intermarket Technical Analysis
- John Murphy on Chart Analysis
- John Murphy's Chart Pattern Recognition
- John Murphy's Market Message
- MurphyExplainsMarketAnalysis-Intermarket Analysis
- MurphyExplainsMarketAnalysis-Visual Analysis
- StockCharts.com
- Technical Analysis of the Financial Markets
- The Visual Investor
- VectorVest, Inc.
- Executive Premier Workshop
- One-Day Options Course
- OptionsPro
- Retirement Income Workshop
- Sure-Fire Trading Systems (VectorVest, Inc.)
- Trading as a Business Workshop
- VectorVest 7 EOD
- VectorVest 7 RealTime/IntraDay
- VectorVest AutoTester
- VectorVest Educational Services
- VectorVest OnLine
- VectorVest Options Analyzer
- VectorVest ProGraphics v6.0
- VectorVest ProTrader 7
- VectorVest RealTime Derby Tool
- VectorVest Simulator
- VectorVest Variator
- VectorVest Watchdog
