HOT TOPICS LIST
- MACD
- Fibonacci
- RSI
- Gann
- ADXR
- Stochastics
- Volume
- Triangles
- Futures
- Cycles
- Volatility
- ZIGZAG
- MESA
- Retracement
- Aroon
INDICATORS LIST
LIST OF TOPICS
PRINT THIS ARTICLE
by Andrew Hetherington
American Express is looking like a good candidate for an upside break.
Position: N/A
Andrew Hetherington
Classic Dow Theorist who trades as a pure technician, using pattern recognition.
PRINT THIS ARTICLE
CHART ANALYSIS
American Express and the BKX Index
05/01/03 01:42:23 PMby Andrew Hetherington
American Express is looking like a good candidate for an upside break.
Position: N/A
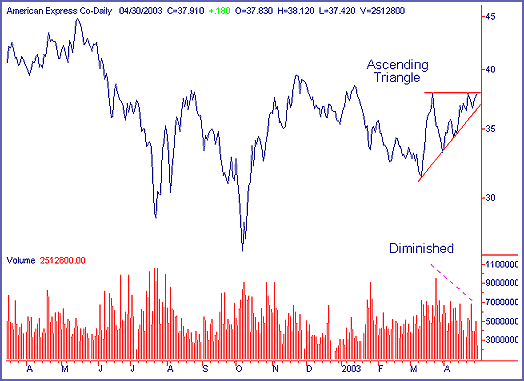
 Figure 1: American Express daily chart. I've illustrated the ascending triangle on American Express (AXP) with a line on close style of chart. It is easier to visualize the triangle on this chart compared to the bar chart. This triangle is ready to break topside like so many others currently. |
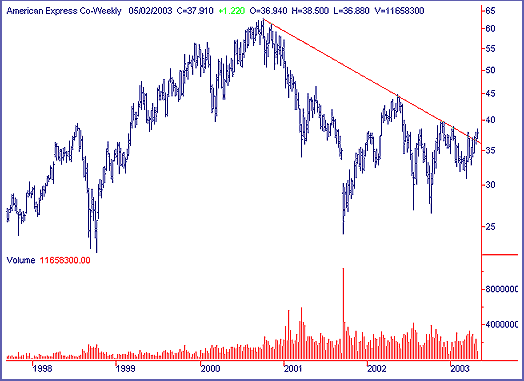
 Figure 2: American Express weekly or intermediate chart. The intermediate downtrend was broken in the past few days and the anticipation of higher prices is likely in the medium- to long-term. |

|
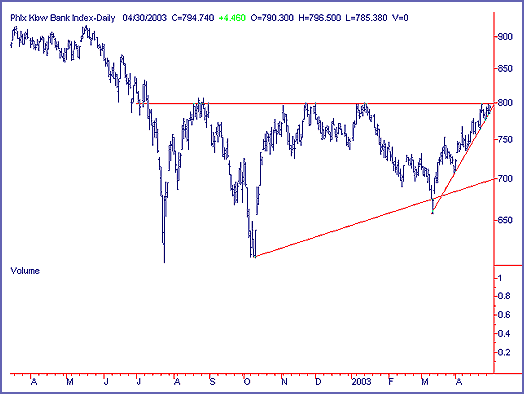
| Figure 3: Chart of the BKX Index. |
| Graphic provided by: SuperCharts. |
| |
| The Philadelphia Bank Index (BKX) illustrates how strong the financials have been lately. Remember that the financials fuel the rise in the market. The BKX will break topside of 800. Although there is no volume on this index, making it less reliable when interpreting it, I still feel the triangle or the head and shoulders bottom reversal is present. There won't be confirmation until 800 is broken. If this happens as I anticipate, along with the Dow breaking topside at 8550, then there should be a run towards 875 before a brief but inevitable throwback to the low 800s. This will be another opportunity to take a long position on this throwback. |
Classic Dow Theorist who trades as a pure technician, using pattern recognition.
| Toronto, Canada |
Click here for more information about our publications!
Comments
Date: 05/13/03Rank: 4Comment:

Request Information From Our Sponsors
- StockCharts.com, Inc.
- Candle Patterns
- Candlestick Charting Explained
- Intermarket Technical Analysis
- John Murphy on Chart Analysis
- John Murphy's Chart Pattern Recognition
- John Murphy's Market Message
- MurphyExplainsMarketAnalysis-Intermarket Analysis
- MurphyExplainsMarketAnalysis-Visual Analysis
- StockCharts.com
- Technical Analysis of the Financial Markets
- The Visual Investor
- VectorVest, Inc.
- Executive Premier Workshop
- One-Day Options Course
- OptionsPro
- Retirement Income Workshop
- Sure-Fire Trading Systems (VectorVest, Inc.)
- Trading as a Business Workshop
- VectorVest 7 EOD
- VectorVest 7 RealTime/IntraDay
- VectorVest AutoTester
- VectorVest Educational Services
- VectorVest OnLine
- VectorVest Options Analyzer
- VectorVest ProGraphics v6.0
- VectorVest ProTrader 7
- VectorVest RealTime Derby Tool
- VectorVest Simulator
- VectorVest Variator
- VectorVest Watchdog
