HOT TOPICS LIST
- MACD
- Fibonacci
- RSI
- Gann
- ADXR
- Stochastics
- Volume
- Triangles
- Futures
- Cycles
- Volatility
- ZIGZAG
- MESA
- Retracement
- Aroon
INDICATORS LIST
LIST OF TOPICS
PRINT THIS ARTICLE
by Andrew Hetherington
Sometimes you have to reverse gears when trading within a pattern. . .
Position: N/A
Andrew Hetherington
Classic Dow Theorist who trades as a pure technician, using pattern recognition.
PRINT THIS ARTICLE
CHART ANALYSIS
Qualcomm, Nortel, and Intel Updated
05/01/03 01:12:45 PMby Andrew Hetherington
Sometimes you have to reverse gears when trading within a pattern. . .
Position: N/A
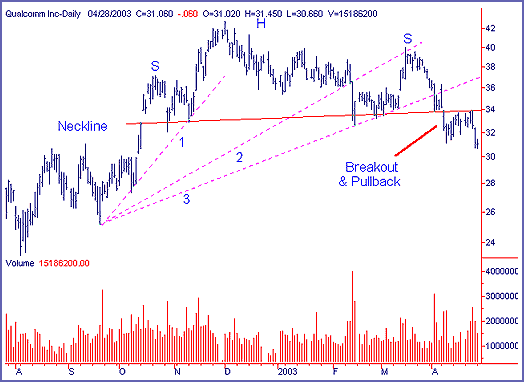
| I have recently written articles on these three equities saying they appeared to be moving lower. The Qualcomm article was the only one with a confirmed pattern, once again illustrating the pitfalls of trading within the pattern. As I have often cautioned, this is a real danger, particularly when the market is in a transition stage as it is now. It is during these periods of transition where making a bad trade can be treacherous and expensive. |

|
| Figure 1: Qualcomm's daily chart. |
| Graphic provided by: SuperCharts. |
| |
| The Qualcomm chart is still intact but if I were short I would have sold out my position on April 27, 2003 in the $31.00 area, anticipating the Dow move higher if the 300 million plus shares comes into play as I suspect it will soon. |
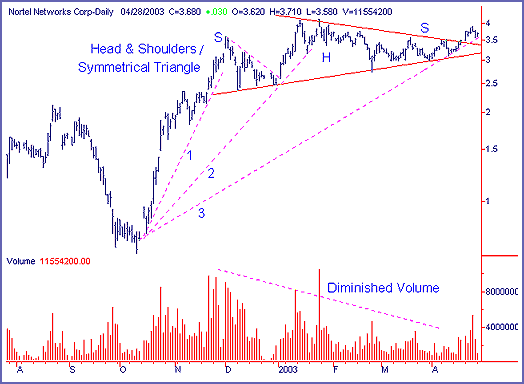
 Figure 2: Nortel's daily chart. The Nortel chart proved to be a symmetrical triangle, not the head and shoulders top that I was anticipating. The triangle broke topside and is now set to move significantly higher. This is a very nice chart and a long position is recommended. I'm changing gears mid-stream on this equity as the chart dictates and am anticipating a pick up in activity to confirm this move. |
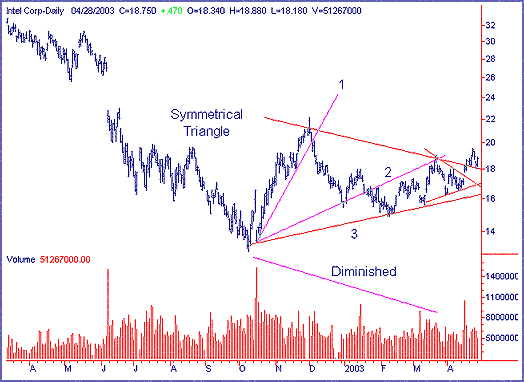
 Figure 3: Intel's daily chart. The Intel chart has also broken topside of the triangle and has had a throwback similar to Nortel. This equity is poised to move much higher and has broken its intermediate term downtrend. I'm also changing gears on this equity suggesting long positions while the Dow cooperates. |
Classic Dow Theorist who trades as a pure technician, using pattern recognition.
| Toronto, Canada |
Click here for more information about our publications!
Comments
Date: 05/08/03Rank: 4Comment:
Date: 05/22/03Rank: 5Comment:

Request Information From Our Sponsors
- StockCharts.com, Inc.
- Candle Patterns
- Candlestick Charting Explained
- Intermarket Technical Analysis
- John Murphy on Chart Analysis
- John Murphy's Chart Pattern Recognition
- John Murphy's Market Message
- MurphyExplainsMarketAnalysis-Intermarket Analysis
- MurphyExplainsMarketAnalysis-Visual Analysis
- StockCharts.com
- Technical Analysis of the Financial Markets
- The Visual Investor
- VectorVest, Inc.
- Executive Premier Workshop
- One-Day Options Course
- OptionsPro
- Retirement Income Workshop
- Sure-Fire Trading Systems (VectorVest, Inc.)
- Trading as a Business Workshop
- VectorVest 7 EOD
- VectorVest 7 RealTime/IntraDay
- VectorVest AutoTester
- VectorVest Educational Services
- VectorVest OnLine
- VectorVest Options Analyzer
- VectorVest ProGraphics v6.0
- VectorVest ProTrader 7
- VectorVest RealTime Derby Tool
- VectorVest Simulator
- VectorVest Variator
- VectorVest Watchdog
