

HOT TOPICS LIST
- MACD
- Fibonacci
- RSI
- Gann
- ADXR
- Stochastics
- Volume
- Triangles
- Futures
- Cycles
- Volatility
- ZIGZAG
- MESA
- Retracement
- Aroon
INDICATORS LIST
LIST OF TOPICS
PRINT THIS ARTICLE
by Andrew Hetherington
Nextel has broken through their rectangle formation that had been in a consolidation pattern going back to November.
Position: Accumulate
Andrew Hetherington
Classic Dow Theorist who trades as a pure technician, using pattern recognition.
PRINT THIS ARTICLE
RECTANGLES
Nextel Has Turned Around
05/01/03 12:01:38 PMby Andrew Hetherington
Nextel has broken through their rectangle formation that had been in a consolidation pattern going back to November.
Position: Accumulate
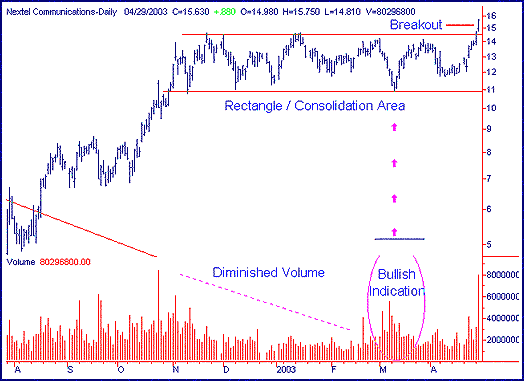 Figure 1: Nextel's daily chart. On Nextel's (NXTL) daily chart a rectangle or a consolidation area has formed. Either is correct since the volume is not perfectly diminished. My preference is a rectangle. It has just broken topside of this 6-month pattern and you can expect a breakout move to the resistance area of $17.50 before taking the inevitable breather. At this point a throwback to the resistance, which is now the support, in the $14.50 area would be a good time to accumulate long positions. |
| The intermediate downtrend was broken in July and August, signaling another appropriate time to accumulate. I prefer to wait for a pattern to develop before taking a position. However, some believe bottom fishing is a strategy to employ. I must caution anyone using this strategy that it is difficult to anticipate a bottom, even for the most seasoned technician. In March we were given the benefit of an early bullish indicator when the volume increased substantially off of the bottom line of the rectangle. |
|
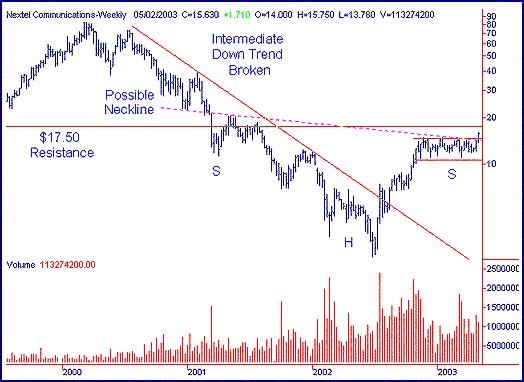
| Figure 2: Nextel's weekly chart. |
| Graphic provided by: SuperCharts. |
| |
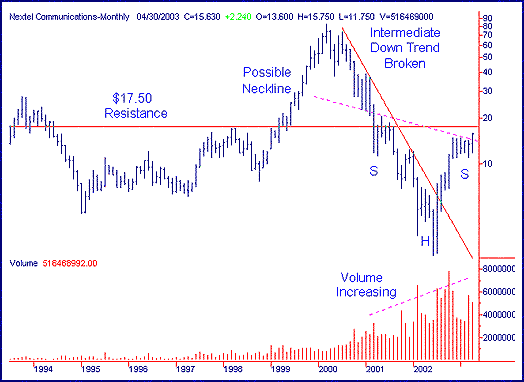 Figure 3: Nextel's monthly chart. The weekly and monthly chart show that the downtrend is clearly broken, as well as the gradual increasing volume since March 2001. This potential head and shoulders picture is far from perfect but the volume picture is perfect. This volume gives every indication that the head and shoulders bottom reversal pattern exists with a downsloping neckline. The left and right shoulders are somewhat abbreviated, but there is symmetry. My prognostication is for this equity to be at a much higher price in the medium- to long-term and accumulating a long position in the $14.50 area will prove to be a sound investment. |
Classic Dow Theorist who trades as a pure technician, using pattern recognition.
| Toronto, Canada |
Click here for more information about our publications!
Comments
Date:�05/01/03Rank:�4Comment:�

Request Information From Our Sponsors
- VectorVest, Inc.
- Executive Premier Workshop
- One-Day Options Course
- OptionsPro
- Retirement Income Workshop
- Sure-Fire Trading Systems (VectorVest, Inc.)
- Trading as a Business Workshop
- VectorVest 7 EOD
- VectorVest 7 RealTime/IntraDay
- VectorVest AutoTester
- VectorVest Educational Services
- VectorVest OnLine
- VectorVest Options Analyzer
- VectorVest ProGraphics v6.0
- VectorVest ProTrader 7
- VectorVest RealTime Derby Tool
- VectorVest Simulator
- VectorVest Variator
- VectorVest Watchdog
- StockCharts.com, Inc.
- Candle Patterns
- Candlestick Charting Explained
- Intermarket Technical Analysis
- John Murphy on Chart Analysis
- John Murphy's Chart Pattern Recognition
- John Murphy's Market Message
- MurphyExplainsMarketAnalysis-Intermarket Analysis
- MurphyExplainsMarketAnalysis-Visual Analysis
- StockCharts.com
- Technical Analysis of the Financial Markets
- The Visual Investor