HOT TOPICS LIST
- MACD
- Fibonacci
- RSI
- Gann
- ADXR
- Stochastics
- Volume
- Triangles
- Futures
- Cycles
- Volatility
- ZIGZAG
- MESA
- Retracement
- Aroon
INDICATORS LIST
LIST OF TOPICS
PRINT THIS ARTICLE
by Andrew Hetherington
Every now and again you get fooled. Previously, I was off base on this very strong chart pattern. Since then, an upsloping trend channel has developed indicating further upside movement for this stock.
Position: N/A
Andrew Hetherington
Classic Dow Theorist who trades as a pure technician, using pattern recognition.
PRINT THIS ARTICLE
CHART ANALYSIS
Amazon.com, Surprisingly Strong
04/29/03 02:55:38 PMby Andrew Hetherington
Every now and again you get fooled. Previously, I was off base on this very strong chart pattern. Since then, an upsloping trend channel has developed indicating further upside movement for this stock.
Position: N/A
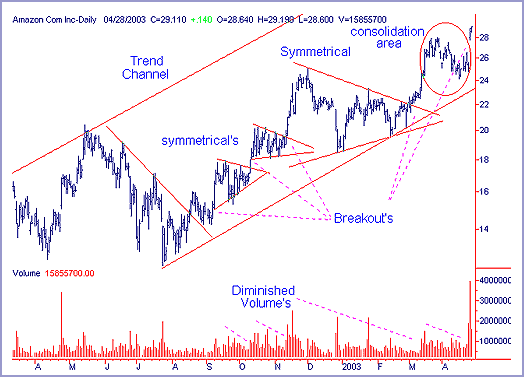
| In my earlier article in October of 2002, I suggested that a head and shoulders was completing and suggested a short position in the $16.00 area off of the top line. Naturally, you would have been stopped out near the $18.00 area, but this is a good example of why I suggest caution when trading within the pattern. The volume was erratic and the head and shoulders bottom reversal never materialized. However, there were a series of very nice small patterns within an upsloping trend channel that has propelled this equity significantly higher. I marked this trend channel from the base of the head up along the potential right shoulder. This performance line that I have often referred to would have kept the keen trader out of trouble, and will keep them in their long position until it is broken. As of this writing, the performance line is still intact. This enables traders to stay along for the entire duration of the ride upwards. |
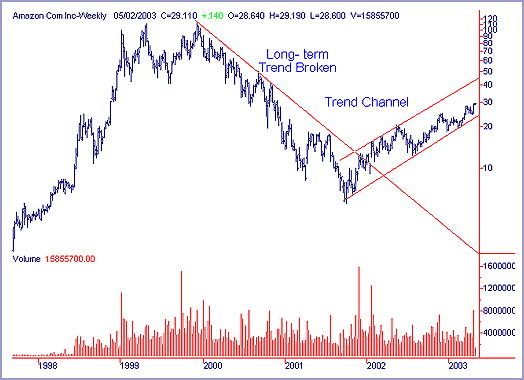
 Figure 1: Daily chart of Amazon.com. The signal for buying a long position came in August, 2002 when Amazon broke its trend upwards in the $14.75 area. After the break it made a series of small symmetrical triangles with good volume on each pattern. These patterns have proven to be dependable and repetitive. There is a consolidation area during March and April that has broken topside as well. Expecting a small throwback towards the bottom of the trend channel is a good prognostication, unfortunately, this equity has demonstrated resilience. I would watch the performance line and only sell my long position if it is broken or if it runs higher towards the top of the channel in the $43.00 area. |

|
| Figure 2: Weekly chart of Amazon.com |
| Graphic provided by: SuperCharts. |
| |
| The Dow is ready to break topside of a small ascending triangle in the 8550 areas and this will help fuel a move higher. In addition, the Dow Transports have just broken topside of a small triangle to confirm this Dow move. This is one of those times where the two indices are in tandem. Usually, the Dow Transports are a laggard. I wouldn't call them a leader by any stretch of the imagination; it's only a difference of a few days on these breakouts and I consider this a simultaneous move. Both indices bottomed on March 12, at least temporarily. |
Classic Dow Theorist who trades as a pure technician, using pattern recognition.
| Toronto, Canada |
Click here for more information about our publications!
PRINT THIS ARTICLE

Request Information From Our Sponsors
- StockCharts.com, Inc.
- Candle Patterns
- Candlestick Charting Explained
- Intermarket Technical Analysis
- John Murphy on Chart Analysis
- John Murphy's Chart Pattern Recognition
- John Murphy's Market Message
- MurphyExplainsMarketAnalysis-Intermarket Analysis
- MurphyExplainsMarketAnalysis-Visual Analysis
- StockCharts.com
- Technical Analysis of the Financial Markets
- The Visual Investor
- VectorVest, Inc.
- Executive Premier Workshop
- One-Day Options Course
- OptionsPro
- Retirement Income Workshop
- Sure-Fire Trading Systems (VectorVest, Inc.)
- Trading as a Business Workshop
- VectorVest 7 EOD
- VectorVest 7 RealTime/IntraDay
- VectorVest AutoTester
- VectorVest Educational Services
- VectorVest OnLine
- VectorVest Options Analyzer
- VectorVest ProGraphics v6.0
- VectorVest ProTrader 7
- VectorVest RealTime Derby Tool
- VectorVest Simulator
- VectorVest Variator
- VectorVest Watchdog
