HOT TOPICS LIST
- MACD
- Fibonacci
- RSI
- Gann
- ADXR
- Stochastics
- Volume
- Triangles
- Futures
- Cycles
- Volatility
- ZIGZAG
- MESA
- Retracement
- Aroon
INDICATORS LIST
LIST OF TOPICS
PRINT THIS ARTICLE
by Andrew Hetherington
GMT's near-perfect triangle formation breaks out to the upside.
Position: N/A
Andrew Hetherington
Classic Dow Theorist who trades as a pure technician, using pattern recognition.
PRINT THIS ARTICLE
CHART ANALYSIS
GATX Corporation (GMT) Has Bottomed
04/16/03 11:49:13 AMby Andrew Hetherington
GMT's near-perfect triangle formation breaks out to the upside.
Position: N/A

|
| Graphic provided by: SuperCharts. |
| |
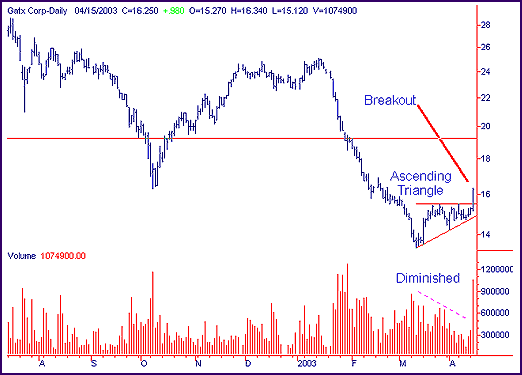
| On the daily chart of Gatx Corporation (GMT) a 1-month ascending triangle has formed with perfect volume. The breakout happened on April 15, 2003 in the $15.50 area. This breakout occurred on heavy volume, which is a signal of accumulation and strength. Although this is not a big reversal pattern, you must consider all the factors (see my previous article, Gatx Corporation, Traders.com Advantage, August of 2002). |
| The big volumes at the bottom in the $14.00 area signal the accumulation as well. GMT achieved the downward move I anticipated in August and now a small bullish pattern has formed. There appears to be plenty of interest in this area and if you are patient, this slow moving turtle will be profitable. |
| An upward move towards the resistance area, which was the support, is now a likely place to unload your long position. A buy point in the $15.50 to $16.00 area is a safe bet with an eye on the general trend and the top line of the triangle in the $15.50 area as your stop protection. |
Classic Dow Theorist who trades as a pure technician, using pattern recognition.
| Toronto, Canada |
Click here for more information about our publications!
Comments
Date: 04/16/03Rank: 4Comment:
Date: 04/22/03Rank: 5Comment:
Date: 04/24/03Rank: 5Comment:

Request Information From Our Sponsors
- StockCharts.com, Inc.
- Candle Patterns
- Candlestick Charting Explained
- Intermarket Technical Analysis
- John Murphy on Chart Analysis
- John Murphy's Chart Pattern Recognition
- John Murphy's Market Message
- MurphyExplainsMarketAnalysis-Intermarket Analysis
- MurphyExplainsMarketAnalysis-Visual Analysis
- StockCharts.com
- Technical Analysis of the Financial Markets
- The Visual Investor
- VectorVest, Inc.
- Executive Premier Workshop
- One-Day Options Course
- OptionsPro
- Retirement Income Workshop
- Sure-Fire Trading Systems (VectorVest, Inc.)
- Trading as a Business Workshop
- VectorVest 7 EOD
- VectorVest 7 RealTime/IntraDay
- VectorVest AutoTester
- VectorVest Educational Services
- VectorVest OnLine
- VectorVest Options Analyzer
- VectorVest ProGraphics v6.0
- VectorVest ProTrader 7
- VectorVest RealTime Derby Tool
- VectorVest Simulator
- VectorVest Variator
- VectorVest Watchdog
