HOT TOPICS LIST
- MACD
- Fibonacci
- RSI
- Gann
- ADXR
- Stochastics
- Volume
- Triangles
- Futures
- Cycles
- Volatility
- ZIGZAG
- MESA
- Retracement
- Aroon
INDICATORS LIST
LIST OF TOPICS
PRINT THIS ARTICLE
by Andrew Hetherington
Daily, weekly, and monthly charts are showing formations indicating a drop in Qualcomm's price.
Position: N/A
Andrew Hetherington
Classic Dow Theorist who trades as a pure technician, using pattern recognition.
PRINT THIS ARTICLE
CHART ANALYSIS
Qualcomm Inc. is Heading Lower
04/16/03 11:15:55 AMby Andrew Hetherington
Daily, weekly, and monthly charts are showing formations indicating a drop in Qualcomm's price.
Position: N/A
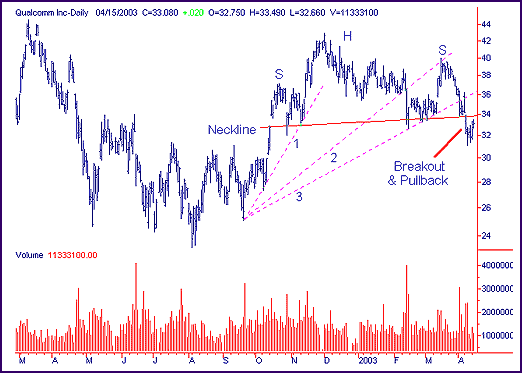
 Figure 1: Qualcomm's daily chart. Qualcomm's (QCOM) daily chart shows a 6-month head and shoulders pattern. Although the pattern has the required diminished volume on the pattern's creation, it is imperfect. Ideally, I prefer spiking volume on the left shoulder with slowly diminished volume throughout the remainder of the pattern. The neckline is at the $34.00 area and there has already been a breakout and pullback to the sell short position near this neckline. |
| The third fan line has been formed and broken on the downside, changing the temporary direction from up to down in the $35.75 area. The downside move will likely bring us down to the next support in the $30.00 area and eventually may reach the $25.00 support. As always, await the hard drop that is inevitable and buy back the short position on this hard drop. Then, ID (impending doom) will come unless the general trend of the Dow changes. |

|
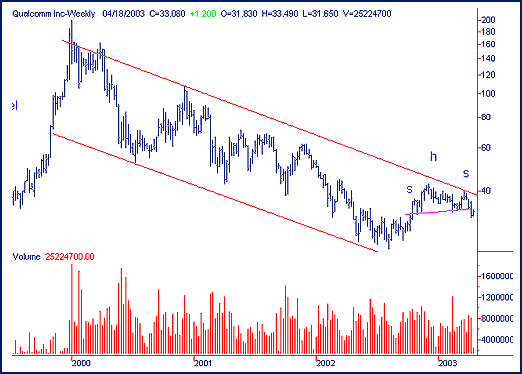
| Figure 2: Weekly chart of QCOM. |
| Graphic provided by: SuperCharts. |
| |
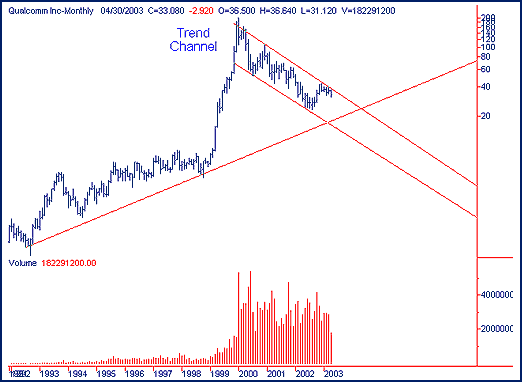
 Figure 3: Monthly chart of QCOM. On the weekly and monthly charts there is a downward trend channel that has the top line in the $40.00 area and the bottom line just under $20.00. |
| As a precaution, consider any breaking of the neckline above the $34.00 area as a signal of a bad choice, and buy back the short position. In addition, watch the general trend of the Dow. Any move above 8550 will signal danger, whereas a drop below 8200 will be advantageous if you are short. |
Classic Dow Theorist who trades as a pure technician, using pattern recognition.
| Toronto, Canada |
Click here for more information about our publications!
PRINT THIS ARTICLE

Request Information From Our Sponsors
- StockCharts.com, Inc.
- Candle Patterns
- Candlestick Charting Explained
- Intermarket Technical Analysis
- John Murphy on Chart Analysis
- John Murphy's Chart Pattern Recognition
- John Murphy's Market Message
- MurphyExplainsMarketAnalysis-Intermarket Analysis
- MurphyExplainsMarketAnalysis-Visual Analysis
- StockCharts.com
- Technical Analysis of the Financial Markets
- The Visual Investor
- VectorVest, Inc.
- Executive Premier Workshop
- One-Day Options Course
- OptionsPro
- Retirement Income Workshop
- Sure-Fire Trading Systems (VectorVest, Inc.)
- Trading as a Business Workshop
- VectorVest 7 EOD
- VectorVest 7 RealTime/IntraDay
- VectorVest AutoTester
- VectorVest Educational Services
- VectorVest OnLine
- VectorVest Options Analyzer
- VectorVest ProGraphics v6.0
- VectorVest ProTrader 7
- VectorVest RealTime Derby Tool
- VectorVest Simulator
- VectorVest Variator
- VectorVest Watchdog
