HOT TOPICS LIST
- MACD
- Fibonacci
- RSI
- Gann
- ADXR
- Stochastics
- Volume
- Triangles
- Futures
- Cycles
- Volatility
- ZIGZAG
- MESA
- Retracement
- Aroon
INDICATORS LIST
LIST OF TOPICS
PRINT THIS ARTICLE
by Arthur Hill
A double bottom formation on the weekly chart for Alcoa Aluminum provides some hope. However, a large double top on the monthly chart doesn't share the same optimism.
Position: N/A
Arthur Hill
Arthur Hill is currently editor of TDTrader.com, a website specializing in trading strategies, sector/industry specific breadth stats and overall technical analysis. He passed the Society of Technical Analysts (STA London) diploma exam with distinction is a Certified Financial Technician (CFTe). Prior to TD Trader, he was the Chief Technical Analyst for Stockcharts.com and the main contributor to the ChartSchool.
PRINT THIS ARTICLE
CHART ANALYSIS
Alcoa Testing Major Trendline
04/16/03 09:58:46 AMby Arthur Hill
A double bottom formation on the weekly chart for Alcoa Aluminum provides some hope. However, a large double top on the monthly chart doesn't share the same optimism.
Position: N/A
| Alcoa (AA) is an aluminum company that is part of the basic materials sector and Dow Jones Industrial Average. As such, the outlook for AA reflects the long-term prospects for the overall stock market and economy. |
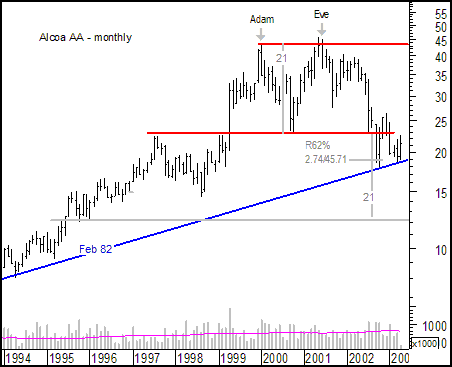
| On the monthly chart, AA formed a large double top with resistance at 44 and support at 23. The first top formed with a single bar and could be called an Adam top (see Thomas Bulkowski's article in the Jan-03 issue of S&C Magazine). The second top formed with two bars and could be referred to as an Eve top. Taken together, the pattern is an Adam-Eve double top. The support break confirmed the double top and the long-term projection is for a decline to around 12. |

|
| Figure 1: Monthly chart for AA. |
| Graphic provided by: MetaStock. |
| |
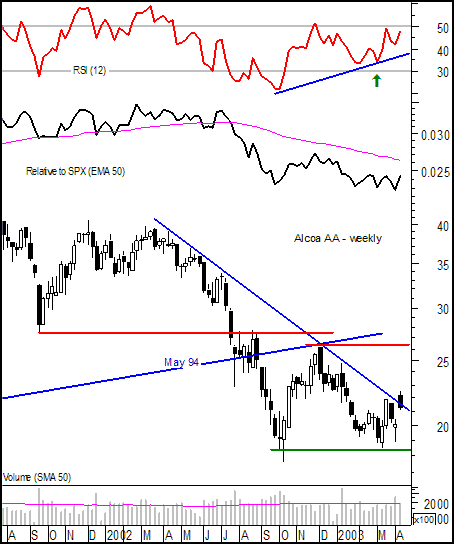
| On the weekly chart, AA is trying to trace out a double bottom, but this pattern is far from complete. The first low would mark an Adam bottom and the second low an Eve bottom for an Adam-Eve double bottom. Before taking this pattern seriously, AA would need to break above key resistance at 26.5 on expanding volume. |
 Figure 2: Weekly chart for AA. RSI confirms a successful support test, but weak volume and relative strength are likely to stem any advance. RSI moved below 30 (oversold) and then formed a positive divergence (green arrow). The higher low reflects less selling pressure (downward momentum) than in October, but RSI has been largely below 50 for a year now and would need to exceed this level to turn momentum positive. AA made a strong two-week move off support in March, but volume was low and the advance stalled at the Apr-02 trendline. Moreover, the advance barely registered on the price relative (AA relative to SPX), which then moved to a new 52-week low last week and remains well below its 50-day EMA. |
Arthur Hill is currently editor of TDTrader.com, a website specializing in trading strategies, sector/industry specific breadth stats and overall technical analysis. He passed the Society of Technical Analysts (STA London) diploma exam with distinction is a Certified Financial Technician (CFTe). Prior to TD Trader, he was the Chief Technical Analyst for Stockcharts.com and the main contributor to the ChartSchool.
| Title: | Editor |
| Company: | TDTrader.com |
| Address: | Willem Geetsstraat 17 |
| Mechelen, B2800 | |
| Phone # for sales: | 3215345465 |
| Website: | www.tdtrader.com |
| E-mail address: | arthurh@tdtrader.com |
Traders' Resource Links | |
| TDTrader.com has not added any product or service information to TRADERS' RESOURCE. | |
Click here for more information about our publications!
PRINT THIS ARTICLE

Request Information From Our Sponsors
- StockCharts.com, Inc.
- Candle Patterns
- Candlestick Charting Explained
- Intermarket Technical Analysis
- John Murphy on Chart Analysis
- John Murphy's Chart Pattern Recognition
- John Murphy's Market Message
- MurphyExplainsMarketAnalysis-Intermarket Analysis
- MurphyExplainsMarketAnalysis-Visual Analysis
- StockCharts.com
- Technical Analysis of the Financial Markets
- The Visual Investor
- VectorVest, Inc.
- Executive Premier Workshop
- One-Day Options Course
- OptionsPro
- Retirement Income Workshop
- Sure-Fire Trading Systems (VectorVest, Inc.)
- Trading as a Business Workshop
- VectorVest 7 EOD
- VectorVest 7 RealTime/IntraDay
- VectorVest AutoTester
- VectorVest Educational Services
- VectorVest OnLine
- VectorVest Options Analyzer
- VectorVest ProGraphics v6.0
- VectorVest ProTrader 7
- VectorVest RealTime Derby Tool
- VectorVest Simulator
- VectorVest Variator
- VectorVest Watchdog
