HOT TOPICS LIST
- MACD
- Fibonacci
- RSI
- Gann
- ADXR
- Stochastics
- Volume
- Triangles
- Futures
- Cycles
- Volatility
- ZIGZAG
- MESA
- Retracement
- Aroon
INDICATORS LIST
LIST OF TOPICS
PRINT THIS ARTICLE
by Koos van der Merwe
On October 29, 2002, I wrote the article "Anyone for Gold?" In it, I used a triangle formation to help determine not only a target price, but a time target as well. Here's a look at what has happened since.
Position: Hold
Koos van der Merwe
Has been a technical analyst since 1969, and has worked as a futures and options trader with First Financial Futures in Johannesburg, South Africa.
PRINT THIS ARTICLE
TRIANGLES
Another Look at the Amex Gold Bugs Index
04/11/03 10:46:45 AMby Koos van der Merwe
On October 29, 2002, I wrote the article "Anyone for Gold?" In it, I used a triangle formation to help determine not only a target price, but a time target as well. Here's a look at what has happened since.
Position: Hold
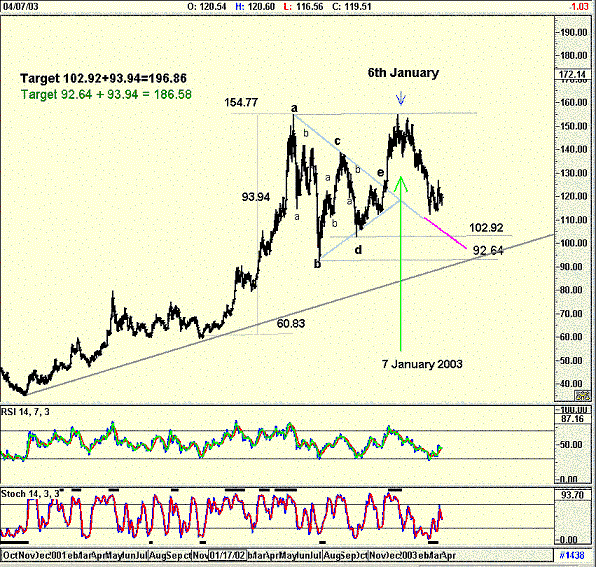
| In the "Anyone for Gold?" article (Traders.com Advantage, 10/29/02), the Amex Gold Bugs Index had only traced as far as 'd' on the chart and I had used the level 'd' (102.92) to calculate a possible target. I determined the distance the Index moved into the triangle, and added this to 'd'. This turned out to be an optimistic error on my part. I should have added this figure to the lowest point of the triangle, 92.64, giving a target of 186.58. However, in actual fact, HUI met strong resistance at 154.77, the highest point of the triangle, and then turned down, missing the time prediction by three days. I had forecast the turning point as January 7, 2003, but the high was reached on Janaury 10th. |
| What now? The stochastic oscillator is suggesting that a bottom has developed and is moving up. The RSI is confirming that the trend is up. The chart could turn the a-c-e upper triangle resistance level into a support line, and follow it down, with a major resistance at the 102.92 and 92.64 levels. Should the index turn, there would be major resistance at the 154.77 level. Any break above this level could see the index hit our targets of 186.58/196.86. |

|
| Figure 1: Amex Gold Bugs Index |
| Graphic provided by: AdvancedGET. |
| |
| The Amex Gold Bugs Index has not tested either of the targets determined by the triangle, both of which are still in place unless the index breaks below the 102.92 or 92.64 level, when it would test the long term support line. Should this happen, then a completly new analysis should be made, and the triangle target will be a failure. |
Has been a technical analyst since 1969, and has worked as a futures and options trader with First Financial Futures in Johannesburg, South Africa.
| Address: | 3256 West 24th Ave |
| Vancouver, BC | |
| Phone # for sales: | 6042634214 |
| E-mail address: | petroosp@gmail.com |
Click here for more information about our publications!
Comments
Date: 04/11/03Rank: 4Comment: You did not mention the possibilty that it is in the process of mutating into an ascending triangle if the current bottom holds. This bottom happens to be a mini inverse head and shoulders. I also noticed that many of the juniors have done exactly the same thing and that is have fallen back to their downtrendlines at the point of their triangle breakouts. The fact that many of the juniors have already found their bottoms could mean that the HUI has already found its bottom.
Date: 04/12/03Rank: 3Comment: I don t know about your chart. My chart shows the HUI sitting right on top of the downtrendline of the triangle. Looks to me like a bottom.
Date: 04/12/03Rank: 3Comment: In addition I also noticed that the HUI is sitting squarely on the long term trendline which was not mentioned in the article. Would not that be the first possible breach downside target before the 102 level? Nice reverse h/s on top of the trendline.

Request Information From Our Sponsors
- VectorVest, Inc.
- Executive Premier Workshop
- One-Day Options Course
- OptionsPro
- Retirement Income Workshop
- Sure-Fire Trading Systems (VectorVest, Inc.)
- Trading as a Business Workshop
- VectorVest 7 EOD
- VectorVest 7 RealTime/IntraDay
- VectorVest AutoTester
- VectorVest Educational Services
- VectorVest OnLine
- VectorVest Options Analyzer
- VectorVest ProGraphics v6.0
- VectorVest ProTrader 7
- VectorVest RealTime Derby Tool
- VectorVest Simulator
- VectorVest Variator
- VectorVest Watchdog
- StockCharts.com, Inc.
- Candle Patterns
- Candlestick Charting Explained
- Intermarket Technical Analysis
- John Murphy on Chart Analysis
- John Murphy's Chart Pattern Recognition
- John Murphy's Market Message
- MurphyExplainsMarketAnalysis-Intermarket Analysis
- MurphyExplainsMarketAnalysis-Visual Analysis
- StockCharts.com
- Technical Analysis of the Financial Markets
- The Visual Investor
