HOT TOPICS LIST
- MACD
- Fibonacci
- RSI
- Gann
- ADXR
- Stochastics
- Volume
- Triangles
- Futures
- Cycles
- Volatility
- ZIGZAG
- MESA
- Retracement
- Aroon
INDICATORS LIST
LIST OF TOPICS
PRINT THIS ARTICLE
by Koos van der Merwe
In my previous article "Risk/Reward Using Point and Figure" (posted 10/24/02), I showed you how to determine a target price using the horizontal and vertical count strategies of point and figure. In this article I will show you how to use a triangle to calculate an expected target price.
Position: Buy
Koos van der Merwe
Has been a technical analyst since 1969, and has worked as a futures and options trader with First Financial Futures in Johannesburg, South Africa.
PRINT THIS ARTICLE
TRIANGLES
Anyone For Gold?
10/29/02 01:24:55 PMby Koos van der Merwe
In my previous article "Risk/Reward Using Point and Figure" (posted 10/24/02), I showed you how to determine a target price using the horizontal and vertical count strategies of point and figure. In this article I will show you how to use a triangle to calculate an expected target price.
Position: Buy
| Gold appears to be moving contra-cyclically to the market. When the market falls, gold starts rising. Among the many indicators I watch to monitor the movement of gold shares, is the Amex Gold Bugs Index ($HUI). I also watch the CBOE Index (GOX), and the Gold and Silver Index (XAU) whose pattern is very similar to the one above. In fact, to smooth out any inconsistencies among the three, I have made a chart where I have added them all together, then divided by three. For the purposes of this article however, the Amex Gold Bugs Index is my index of choice. |
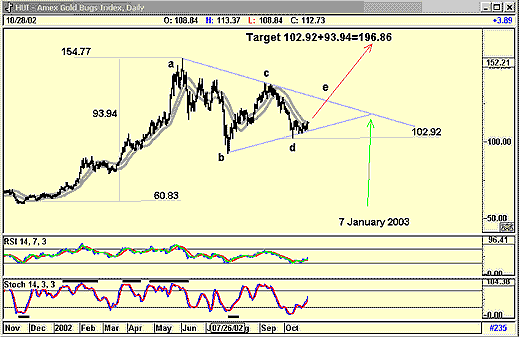
| When you look at the chart, you can see that a very large triangle has developed and is still forming. From the level 60.83, the index moved into the triangle to complete point a at 154.77 on the 4th of June 2002. It then fell to point b by the 26th of July, rose to point c on the 9th of September, and fell to point d at 102.92 on the 10th of October. Note that in this exercise I do not need to know, and have not given the values for b and c. What I did need to know was the value a, the value the chart started moving up from, and the value of d, the base value the price should start moving out of the triangle from. The reason is that a triangle can be a very good method of calculating a target price. |

|
| AMEX GOLD BUGS INDEX |
| Graphic provided by: AdvancedGET. |
| |
| In the chart above, the difference between the start of the rise and point a is 93.94. When I add this amount to the value of point d, I get a target of 196.86. This is telling me the Index could rise by 91% over the next few months. To do this, it would have to break out of the triangle at point e, which could act as a strong resistance level. |
| Finally, a triangle offers one more important insight, one that is not consistent, but when it works, is extremely accurate. It gives you a time target. The apex of the triangle suggests a time target for the price target. In the above chart, the apex suggests that the high of 196.86 could be reached by the 7th of January 2003. |
| By the way, both the RSI and stochastic indicators have turned positive. |
Has been a technical analyst since 1969, and has worked as a futures and options trader with First Financial Futures in Johannesburg, South Africa.
| Address: | 3256 West 24th Ave |
| Vancouver, BC | |
| Phone # for sales: | 6042634214 |
| E-mail address: | petroosp@gmail.com |
Click here for more information about our publications!
Comments

Request Information From Our Sponsors
- VectorVest, Inc.
- Executive Premier Workshop
- One-Day Options Course
- OptionsPro
- Retirement Income Workshop
- Sure-Fire Trading Systems (VectorVest, Inc.)
- Trading as a Business Workshop
- VectorVest 7 EOD
- VectorVest 7 RealTime/IntraDay
- VectorVest AutoTester
- VectorVest Educational Services
- VectorVest OnLine
- VectorVest Options Analyzer
- VectorVest ProGraphics v6.0
- VectorVest ProTrader 7
- VectorVest RealTime Derby Tool
- VectorVest Simulator
- VectorVest Variator
- VectorVest Watchdog
- StockCharts.com, Inc.
- Candle Patterns
- Candlestick Charting Explained
- Intermarket Technical Analysis
- John Murphy on Chart Analysis
- John Murphy's Chart Pattern Recognition
- John Murphy's Market Message
- MurphyExplainsMarketAnalysis-Intermarket Analysis
- MurphyExplainsMarketAnalysis-Visual Analysis
- StockCharts.com
- Technical Analysis of the Financial Markets
- The Visual Investor
