

HOT TOPICS LIST
- MACD
- Fibonacci
- RSI
- Gann
- ADXR
- Stochastics
- Volume
- Triangles
- Futures
- Cycles
- Volatility
- ZIGZAG
- MESA
- Retracement
- Aroon
INDICATORS LIST
LIST OF TOPICS
PRINT THIS ARTICLE
by Arthur Hill
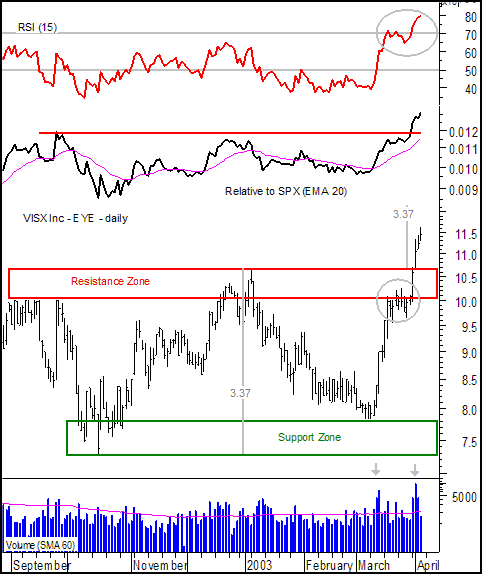
With the advance off the March lows, the major indexes have retraced 50-62% of their Jan-Mar declines. During this same timeframe, VISX Inc. (EYE) outperformed the major indexes by exceeding similar retracement levels and breaking above key resistance at 10.67.
Position: N/A
Arthur Hill
Arthur Hill is currently editor of TDTrader.com, a website specializing in trading strategies, sector/industry specific breadth stats and overall technical analysis. He passed the Society of Technical Analysts (STA London) diploma exam with distinction is a Certified Financial Technician (CFTe). Prior to TD Trader, he was the Chief Technical Analyst for Stockcharts.com and the main contributor to the ChartSchool.
PRINT THIS ARTICLE
CONSOLID FORMATION
VISX Inc. Breaks Eight Month Consolidation
04/08/03 09:55:43 AMby Arthur Hill
With the advance off the March lows, the major indexes have retraced 50-62% of their Jan-Mar declines. During this same timeframe, VISX Inc. (EYE) outperformed the major indexes by exceeding similar retracement levels and breaking above key resistance at 10.67.
Position: N/A
| Support and resistance levels are not always exact. Sometimes it is sensible to work with support and resistance zones. The October low for VISX Inc. established the first support line at 7.3 and the March low established the second support line at 7.8. Taking both into consideration, a support zone was established between 7.3 and 7.8 (green rectangle). |
| Similarly, the September high established a resistance line at 10 and the January high established a second resistance line at 10.67. Taken together, a resistance zone was established between 10 and 10.67 (red rectangle). |
|
| Figure 1: Daily price chart for VISX, Inc. (EYE). |
| Graphic provided by: MetaStock. |
| |
| The pattern over the last seven months looks like a large double bottom and the clear break above the resistance zone is bullish. Based on traditional technical analysis, the projected advance would be to around 14 (10.67 - 7.30 = 3.37, 10.67 + 3.37 = 14.04). To help validate the breakout, volume expanded on both the March advance and April resistance break. In addition, the price relative (EYE relative to the S&P 500) broke resistance and advanced to its highest level since May, thus confirming good relative strength. |
| While still firmly bullish, EYE is getting overextended and may be ripe for a pullback. The stock is up over 40% in less than a month and RSI moved above 70 (overbought) in late March. Double bottoms are prone to throwbacks that could entail a return to the resistance zone, which now turns into support, or a Fibonacci (38-62%) retracement of the current advance. Such a pullback or correction often provides a second chance to initiate long positions with a better reward/risk ratio. |
Arthur Hill is currently editor of TDTrader.com, a website specializing in trading strategies, sector/industry specific breadth stats and overall technical analysis. He passed the Society of Technical Analysts (STA London) diploma exam with distinction is a Certified Financial Technician (CFTe). Prior to TD Trader, he was the Chief Technical Analyst for Stockcharts.com and the main contributor to the ChartSchool.
| Title: | Editor |
| Company: | TDTrader.com |
| Address: | Willem Geetsstraat 17 |
| Mechelen, B2800 | |
| Phone # for sales: | 3215345465 |
| Website: | www.tdtrader.com |
| E-mail address: | arthurh@tdtrader.com |
Traders' Resource Links | |
| TDTrader.com has not added any product or service information to TRADERS' RESOURCE. | |
Click here for more information about our publications!
PRINT THIS ARTICLE

Request Information From Our Sponsors
- StockCharts.com, Inc.
- Candle Patterns
- Candlestick Charting Explained
- Intermarket Technical Analysis
- John Murphy on Chart Analysis
- John Murphy's Chart Pattern Recognition
- John Murphy's Market Message
- MurphyExplainsMarketAnalysis-Intermarket Analysis
- MurphyExplainsMarketAnalysis-Visual Analysis
- StockCharts.com
- Technical Analysis of the Financial Markets
- The Visual Investor
- VectorVest, Inc.
- Executive Premier Workshop
- One-Day Options Course
- OptionsPro
- Retirement Income Workshop
- Sure-Fire Trading Systems (VectorVest, Inc.)
- Trading as a Business Workshop
- VectorVest 7 EOD
- VectorVest 7 RealTime/IntraDay
- VectorVest AutoTester
- VectorVest Educational Services
- VectorVest OnLine
- VectorVest Options Analyzer
- VectorVest ProGraphics v6.0
- VectorVest ProTrader 7
- VectorVest RealTime Derby Tool
- VectorVest Simulator
- VectorVest Variator
- VectorVest Watchdog