HOT TOPICS LIST
- MACD
- Fibonacci
- RSI
- Gann
- ADXR
- Stochastics
- Volume
- Triangles
- Futures
- Cycles
- Volatility
- ZIGZAG
- MESA
- Retracement
- Aroon
INDICATORS LIST
LIST OF TOPICS
PRINT THIS ARTICLE
by Andrew Hetherington
Looking at the daily, weekly and monthly charts for Intel Corporation [INTC] may provide some clues for future moves within the computer chip sector.
Position: N/A
Andrew Hetherington
Classic Dow Theorist who trades as a pure technician, using pattern recognition.
PRINT THIS ARTICLE
CHART ANALYSIS
Are You Betting With The Chips?
04/03/03 01:28:30 PMby Andrew Hetherington
Looking at the daily, weekly and monthly charts for Intel Corporation [INTC] may provide some clues for future moves within the computer chip sector.
Position: N/A
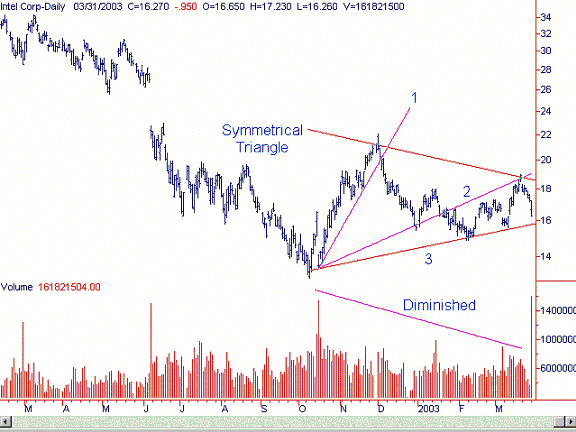
On the daily chart for Intel (Figure 1) we have a 6-month symmetrical triangle. This triangle has the required volume diminishing from left to right. The third fan line is the bottom line on the triangle. The pickup in volume on the downside today (March 31, 2003) gives the early warning of the ID (impending doom) to come. The data provider has the incorrect data illustrated. The actual volume today is 67 million shares for the entire day and not 161 million shares. The third fan line and the bottom of the triangle will breakout on the downside in the $15.80 area. Figure 1: Daily chart for INTC. |
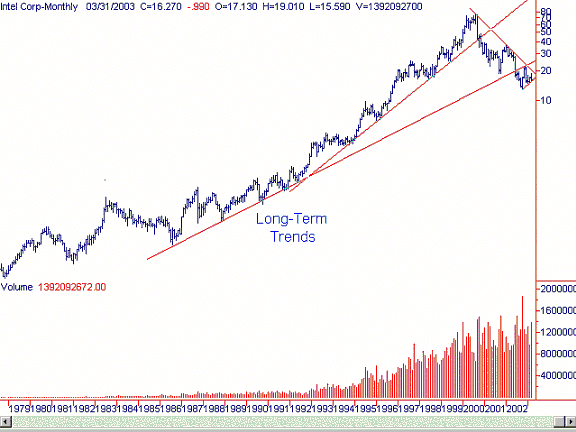
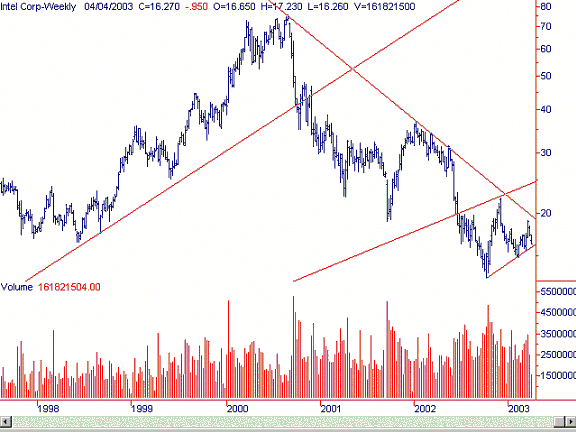
| The long-term trends were broken in the $41.00 area in October 2000 and at $20.00 in June of 2002 (Figure 2). The weekly chart (Figure 3) illustrates the overhead resistance for the intermediate trend in the $20.00 area. Shorting off of this trend line and the top of the triangle in the $19.00 area would have proven to be a shrewd trade. |

|
| Figure 2: Monthly chart for INTC. |
| Graphic provided by: SuperCharts. |
| |
 Figure 3: Weekly chart for INTC. The downside move may not be fast but it will go towards the lower support levels of $14.00 and $10.00 eventually. |
Classic Dow Theorist who trades as a pure technician, using pattern recognition.
| Toronto, Canada |
Click here for more information about our publications!
Comments
Date: 04/08/03Rank: 4Comment:
Date: 04/08/03Rank: 5Comment:

Request Information From Our Sponsors
- VectorVest, Inc.
- Executive Premier Workshop
- One-Day Options Course
- OptionsPro
- Retirement Income Workshop
- Sure-Fire Trading Systems (VectorVest, Inc.)
- Trading as a Business Workshop
- VectorVest 7 EOD
- VectorVest 7 RealTime/IntraDay
- VectorVest AutoTester
- VectorVest Educational Services
- VectorVest OnLine
- VectorVest Options Analyzer
- VectorVest ProGraphics v6.0
- VectorVest ProTrader 7
- VectorVest RealTime Derby Tool
- VectorVest Simulator
- VectorVest Variator
- VectorVest Watchdog
- StockCharts.com, Inc.
- Candle Patterns
- Candlestick Charting Explained
- Intermarket Technical Analysis
- John Murphy on Chart Analysis
- John Murphy's Chart Pattern Recognition
- John Murphy's Market Message
- MurphyExplainsMarketAnalysis-Intermarket Analysis
- MurphyExplainsMarketAnalysis-Visual Analysis
- StockCharts.com
- Technical Analysis of the Financial Markets
- The Visual Investor
