HOT TOPICS LIST
- MACD
- Fibonacci
- RSI
- Gann
- ADXR
- Stochastics
- Volume
- Triangles
- Futures
- Cycles
- Volatility
- ZIGZAG
- MESA
- Retracement
- Aroon
INDICATORS LIST
LIST OF TOPICS
PRINT THIS ARTICLE
by Koos van der Merwe
Geron Corporation announced, on April 1, 2003, that they had published research results describing the production of hepatocytes (basic functional cells of the liver) from human embryonic stem cells. As important as this announcement is for the medical world, is the jump in the share price overblown?
Position: Sell
Koos van der Merwe
Has been a technical analyst since 1969, and has worked as a futures and options trader with First Financial Futures in Johannesburg, South Africa.
PRINT THIS ARTICLE
GAPS
GERON CORP. Is it a short?
04/04/03 01:13:38 PMby Koos van der Merwe
Geron Corporation announced, on April 1, 2003, that they had published research results describing the production of hepatocytes (basic functional cells of the liver) from human embryonic stem cells. As important as this announcement is for the medical world, is the jump in the share price overblown?
Position: Sell
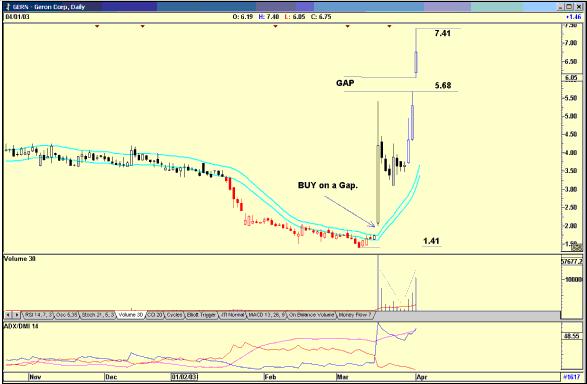
| Over the past two years, the price has fallen from a high of $76.49 on the March 31, 2000 to a low of $1.41 on March 11, 2003. The price started rising from this low and gave a JM buy signal on a gap on March 18, 2003. |
| The JM internal band is a 15-day moving average offset on either side by 2%. I will, however, change the offset depending on past performance of the share price. In the above example, the offset is 4% positive and 4% negative, as share prices, in moving down, continually bounced off these levels. |

|
| Figure 1: Daily chart for GERN. |
| Graphic provided by: AdvancedGET. |
| |
| The chart shows how the price moved up sharply from a retracement after the buy signal of March 18, 2003 jumping higher on a gap when the announcement on April 1, 2003 was made. Most indicators like RSI and stochastic are influenced by the steady fall in price, and would not have given an early warning signal that something imminent in the company was about to happen. However, a look at the volume after the strong rise on March 18, 2003 shows that the correction that followed was on falling volume, a sign of strength. As the price bottomed, volume started picking up, showing that buyers were coming back into the market. Then of course, the above average volume and the gap from March 28, 2003 onwards were further clues. |
| The rule is that prices will fall to "fill the gap." This means that the price of Geron Corp could fall from a high of $7.41 to the lower level of the gap, $5.68, a good possible short for traders. |
Has been a technical analyst since 1969, and has worked as a futures and options trader with First Financial Futures in Johannesburg, South Africa.
| Address: | 3256 West 24th Ave |
| Vancouver, BC | |
| Phone # for sales: | 6042634214 |
| E-mail address: | petroosp@gmail.com |
Click here for more information about our publications!
PRINT THIS ARTICLE

Request Information From Our Sponsors
- VectorVest, Inc.
- Executive Premier Workshop
- One-Day Options Course
- OptionsPro
- Retirement Income Workshop
- Sure-Fire Trading Systems (VectorVest, Inc.)
- Trading as a Business Workshop
- VectorVest 7 EOD
- VectorVest 7 RealTime/IntraDay
- VectorVest AutoTester
- VectorVest Educational Services
- VectorVest OnLine
- VectorVest Options Analyzer
- VectorVest ProGraphics v6.0
- VectorVest ProTrader 7
- VectorVest RealTime Derby Tool
- VectorVest Simulator
- VectorVest Variator
- VectorVest Watchdog
- StockCharts.com, Inc.
- Candle Patterns
- Candlestick Charting Explained
- Intermarket Technical Analysis
- John Murphy on Chart Analysis
- John Murphy's Chart Pattern Recognition
- John Murphy's Market Message
- MurphyExplainsMarketAnalysis-Intermarket Analysis
- MurphyExplainsMarketAnalysis-Visual Analysis
- StockCharts.com
- Technical Analysis of the Financial Markets
- The Visual Investor
