HOT TOPICS LIST
- MACD
- Fibonacci
- RSI
- Gann
- ADXR
- Stochastics
- Volume
- Triangles
- Futures
- Cycles
- Volatility
- ZIGZAG
- MESA
- Retracement
- Aroon
INDICATORS LIST
LIST OF TOPICS
PRINT THIS ARTICLE
by Koos van der Merwe
Can technical analysis foretell the future? I don't believe it can, but I do believe that technical analysis does encompass everything that is out there, and by this I mean fundamental and emotional actions and projections - facts and feelings.
Position: Hold
Koos van der Merwe
Has been a technical analyst since 1969, and has worked as a futures and options trader with First Financial Futures in Johannesburg, South Africa.
PRINT THIS ARTICLE
CYCLES
More On Cycles And The S&P 500
04/03/03 01:07:08 PMby Koos van der Merwe
Can technical analysis foretell the future? I don't believe it can, but I do believe that technical analysis does encompass everything that is out there, and by this I mean fundamental and emotional actions and projections - facts and feelings.
Position: Hold
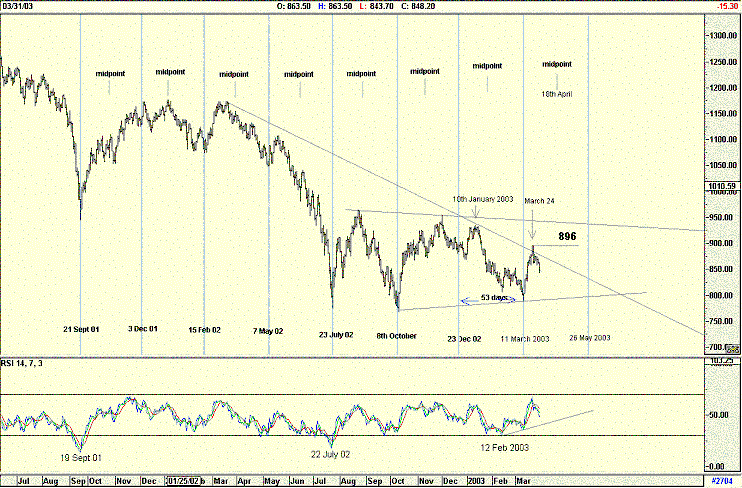
| The chart below is a follow up of the article "Analyzing the S&P 500 Index Using Cycles", Traders.com Advantage, December 13, 2002. In that article I wrote that the S&P500 was following a 53-day cycle and projected that December 23rd 2002 would be the low point of the next cycle. Well, the low actually occurred on the 30th December 2002, but one can blame the holidays, market closes and seasonal distraction for this error. |
| However, the cycle low was spot on for March 11th, and with a high point reached on January 10th 2003, on the left of the midpoint, the trend is still bearish. From the low of March 11th, the index moved up strongly in the early successes of the war in Iraq to peak on the 24th March. Since then, as investor sentiment turned negative, fueled by an over enthusiastic media, that the war is slowing down and could take longer than originally anticipated, the index has started falling and could continue to fall into the low on the 26th May 2003. |

|
| Figure 1: S&P 500 cyclical chart. |
| Graphic provided by: AdvancedGET. |
| |
| Is May 26th an indication of when the war will end? Charts suggest it, but I don't believe so. You must never forget that the market discounts the future, and any speculation as to how the future will unfold, must be taken cautiously. The war could end earlier, with financial complications, or the war could end later, with future prospects extremely rosy. Whatever the result, whether the index will give a higher low, or a lower low, than March 11th, it should make a cycle low on or around May 26th - allow 2 days error either side. |
| Do note that the low of March 11th is higher than the low of October 8th. The December 23rd cycle low was a high low, at the time suggesting a strengthening market. Whether the Index will make a high low on the 26th May, similar to the high low of December 23rd, or whether it will form a low lower than that of October 8th, probably depends on the length of the war and the financial strength of the American economy. |
| The RSI indicator is suggesting strength and the pattern that has developed, should the index rise to retest the 896 level, could be the familiar cup and handle pattern. In the meantime, there can be no speculation as the index moves down towards the cycle low of May 26th. Events will tell us the future and the war will end when it ends. |
Has been a technical analyst since 1969, and has worked as a futures and options trader with First Financial Futures in Johannesburg, South Africa.
| Address: | 3256 West 24th Ave |
| Vancouver, BC | |
| Phone # for sales: | 6042634214 |
| E-mail address: | petroosp@gmail.com |
Click here for more information about our publications!
Comments
Date: 04/05/03Rank: 3Comment:

Request Information From Our Sponsors
- VectorVest, Inc.
- Executive Premier Workshop
- One-Day Options Course
- OptionsPro
- Retirement Income Workshop
- Sure-Fire Trading Systems (VectorVest, Inc.)
- Trading as a Business Workshop
- VectorVest 7 EOD
- VectorVest 7 RealTime/IntraDay
- VectorVest AutoTester
- VectorVest Educational Services
- VectorVest OnLine
- VectorVest Options Analyzer
- VectorVest ProGraphics v6.0
- VectorVest ProTrader 7
- VectorVest RealTime Derby Tool
- VectorVest Simulator
- VectorVest Variator
- VectorVest Watchdog
- StockCharts.com, Inc.
- Candle Patterns
- Candlestick Charting Explained
- Intermarket Technical Analysis
- John Murphy on Chart Analysis
- John Murphy's Chart Pattern Recognition
- John Murphy's Market Message
- MurphyExplainsMarketAnalysis-Intermarket Analysis
- MurphyExplainsMarketAnalysis-Visual Analysis
- StockCharts.com
- Technical Analysis of the Financial Markets
- The Visual Investor
