HOT TOPICS LIST
- MACD
- Fibonacci
- RSI
- Gann
- ADXR
- Stochastics
- Volume
- Triangles
- Futures
- Cycles
- Volatility
- ZIGZAG
- MESA
- Retracement
- Aroon
INDICATORS LIST
LIST OF TOPICS
PRINT THIS ARTICLE
by Koos van der Merwe
In all the years I have been a student of technical analysis, and I go back as early as 1967, using cycles to forecast an index's turning point has always fascinated me.
Position: Sell
Koos van der Merwe
Has been a technical analyst since 1969, and has worked as a futures and options trader with First Financial Futures in Johannesburg, South Africa.
PRINT THIS ARTICLE
CYCLES
Cycles and the S&P 500 Index
12/13/02 09:36:49 AMby Koos van der Merwe
In all the years I have been a student of technical analysis, and I go back as early as 1967, using cycles to forecast an index's turning point has always fascinated me.
Position: Sell
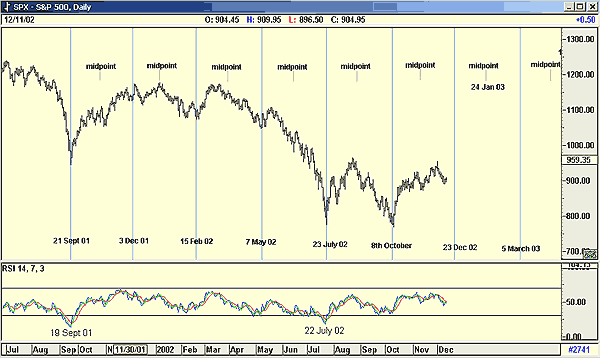
| Looking at the daily chart of the S&P 500 index you can see that the best cycle fit, starting from the September 19, 2001 low, was a 53-day cycle. I initially determined the 53 days by counting the number of days between the double bottom lows of July 23 and the 8th of October, 2002. I then inserted this value into my program's cycle finder (I use AdvanceGet), and the program imposed the 53-day cycle onto the S&P chart. The result surprised me in its accuracy. I have drawn the cycles on the chart using a vertical light blue line. |
| I have also drawn in the midpoint between the lows on the chart below. Based on my years of experience studying cycle patterns, I have noticed that if a high is to the left of the midpoint, then the index is bearish, and to the right of the midpoint, bullish. |

|
| Figure 1: Daily chart of the S&P 500 index. |
| Graphic provided by: AdvancedGET. |
| |
| The above chart shows the following: 1. The number of days between lows is 53 days, and is remarkably consistent, give or take two days either side for the period analyzed. 2. From December 3, 2001 the highs of the cycle started at the midpoint and then gradually shifted to the left of the midpoint. This is indicative of a bear market. 3. From October 8, 2002, the high of the cycle shifted to the right of the midpoint, which is indicative of a bull market. 4. The RSI indicator gave a decisive low on the 19th of September, and again only on July 22, 2002. This is a 209-day cyclical count. I shall project this into the future and watch for a possibly significant low. The date would be May 15, 2003. This is interesting as it suggests that the market could make a major low just before the summer holidays. Usually this would be a high as the mantra 'Sell in May and go away,' suggests. |
| For the future the chart is suggesting that the market could fall until December 23, give or take two days on either side. This means the Christmas rally could develop late this year, AFTER Christmas, and should it run past the January 24th midpoint, the market should remains bullish. Should the index turn before the 24th, this would suggest that the market is still bearish. The next suggested low for the index is March 5, 2003. Finally, a basic cycle chart is simple to prepare, and can be a great help in determining market direction. |
Has been a technical analyst since 1969, and has worked as a futures and options trader with First Financial Futures in Johannesburg, South Africa.
| Address: | 3256 West 24th Ave |
| Vancouver, BC | |
| Phone # for sales: | 6042634214 |
| E-mail address: | petroosp@gmail.com |
Click here for more information about our publications!
Comments
Date: 12/15/02Rank: 4Comment: Interesting.
Date: 12/16/02Rank: 4Comment: v useful dimension of study implemented for probable future direction of the market.
Great.
Date: 12/17/02Rank: 3Comment:
Date: 12/19/02Rank: 4Comment:
Date: 12/21/02Rank: 5Comment:

Request Information From Our Sponsors
- VectorVest, Inc.
- Executive Premier Workshop
- One-Day Options Course
- OptionsPro
- Retirement Income Workshop
- Sure-Fire Trading Systems (VectorVest, Inc.)
- Trading as a Business Workshop
- VectorVest 7 EOD
- VectorVest 7 RealTime/IntraDay
- VectorVest AutoTester
- VectorVest Educational Services
- VectorVest OnLine
- VectorVest Options Analyzer
- VectorVest ProGraphics v6.0
- VectorVest ProTrader 7
- VectorVest RealTime Derby Tool
- VectorVest Simulator
- VectorVest Variator
- VectorVest Watchdog
- StockCharts.com, Inc.
- Candle Patterns
- Candlestick Charting Explained
- Intermarket Technical Analysis
- John Murphy on Chart Analysis
- John Murphy's Chart Pattern Recognition
- John Murphy's Market Message
- MurphyExplainsMarketAnalysis-Intermarket Analysis
- MurphyExplainsMarketAnalysis-Visual Analysis
- StockCharts.com
- Technical Analysis of the Financial Markets
- The Visual Investor
