HOT TOPICS LIST
- MACD
- Fibonacci
- RSI
- Gann
- ADXR
- Stochastics
- Volume
- Triangles
- Futures
- Cycles
- Volatility
- ZIGZAG
- MESA
- Retracement
- Aroon
INDICATORS LIST
LIST OF TOPICS
PRINT THIS ARTICLE
by Matt Blackman
Cray Inc. has moved up almost continuously since January 2002. But the stock is giving signals that could portend a change in direction.
Position: N/A
Matt Blackman
Matt Blackman is a full-time technical and financial writer and trader. He produces corporate and financial newsletters, and assists clients in getting published in the mainstream media. He is the host of TradeSystemGuru.com. Matt has earned the Chartered Market Technician (CMT) designation. Find out what stocks and futures Matt is watching on Twitter at www.twitter.com/RatioTrade
PRINT THIS ARTICLE
MONEY FLOW INDEX
CRAY - Getting Ready to Crash?
04/02/03 03:15:54 PMby Matt Blackman
Cray Inc. has moved up almost continuously since January 2002. But the stock is giving signals that could portend a change in direction.
Position: N/A
| Like many of its peers in the computer industry, Cray Inc. maker of the supercomputer has seen better days, at least from a stock price perspective. It hit a high of $18.18 on September 5, 1997. Other than two brief run-ups in 2000, the stock suffered a steady decline to 2002. It then enjoyed a resurgence jumping from a low of $1.75 in January 2002 to a high of $8.94 on February 28, 2003. |
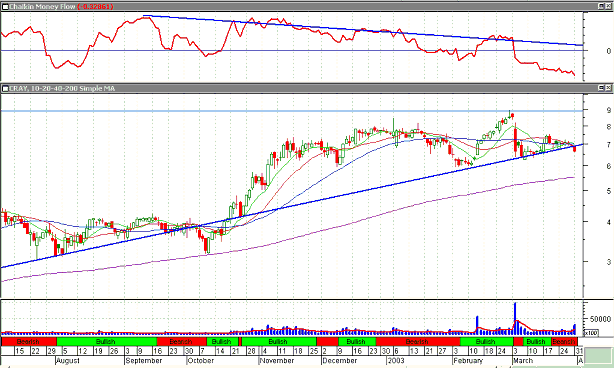
 Figure 1 - Daily chart of Cray Inc. (CRAY) showing negative divergence between the 20-day Chaikin Money Flow (CMF) in upper chart window and price (in main window). However, based on negative divergence between stock price and the Chaikin Money Flow (CMF) on both the daily and weekly charts, it appears that the meteoric rise may be running out of steam. On the daily chart, the CMF began to diverge from price between August and November 2002 and it has continued to decline. |

|
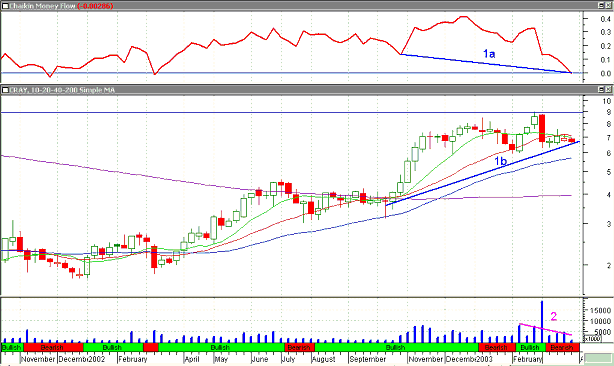
| Figure 2 – CRAY weekly chart showing longer-term divergence between the 20-week CMF (line 1a), price (line 1b) as well as price and volume (line 2). |
| Graphic provided by: MetaStock. |
| |
| The weekly chart shows similar divergence (lines 1a and 1b) and a linear regression line of volume in the last 8 weeks (line 2) shows a negative divergence with price (line 1b) over the same period. Divergence between an oscillator and price provides a heads up that a change in trend may be coming but it is essential to wait for a break in the current equity trend line to occur before acting on the signal. In the case of CRAY, this means that the blue trend line in the daily chart (Figure 1) and line 1b in the weekly must be decisively broken before a short trade is entered. The daily trend line was penetrated on March 31. Confirmation on the weekly chart accompanied by increasing volume would add greater credence to the breakdown. |
| Another sign that the trend is changing is that the 10, 20 and 40 day simple moving averages (SMAs) were all broken between March 27 and March 30th. The next support levels are $6.50 and $5.95, the latter being just under a 50% retracement of the move from $3.55 on October 10, 2002 to $8.94 on February 28, 2003. Fundamentally, CRAY is certainly not a bargain with a trailing price/earnings ratio of 72 (more than 2.4 times the industry average), a price/book of 6.61 and price/cash flow ratio a whopping 81. Quarterly earnings are positive but only just with little more than $0.02 per share reported in the latest period according to the Wall Street Journal. |
| Divergences between momentum indicators and price do not tell us when and by how much the trend will change, only that it is coming. It is up to the trader to determine when to act on this information and how much profit to target. If the breakdown is confirmed, I am looking at the 50% retracement of $5.95 as the next probable target. |
Matt Blackman is a full-time technical and financial writer and trader. He produces corporate and financial newsletters, and assists clients in getting published in the mainstream media. He is the host of TradeSystemGuru.com. Matt has earned the Chartered Market Technician (CMT) designation. Find out what stocks and futures Matt is watching on Twitter at www.twitter.com/RatioTrade
| Company: | TradeSystemGuru.com |
| Address: | Box 2589 |
| Garibaldi Highlands, BC Canada | |
| Phone # for sales: | 604-898-9069 |
| Fax: | 604-898-9069 |
| Website: | www.tradesystemguru.com |
| E-mail address: | indextradermb@gmail.com |
Traders' Resource Links | |
| TradeSystemGuru.com has not added any product or service information to TRADERS' RESOURCE. | |
Click here for more information about our publications!
PRINT THIS ARTICLE

Request Information From Our Sponsors
- StockCharts.com, Inc.
- Candle Patterns
- Candlestick Charting Explained
- Intermarket Technical Analysis
- John Murphy on Chart Analysis
- John Murphy's Chart Pattern Recognition
- John Murphy's Market Message
- MurphyExplainsMarketAnalysis-Intermarket Analysis
- MurphyExplainsMarketAnalysis-Visual Analysis
- StockCharts.com
- Technical Analysis of the Financial Markets
- The Visual Investor
- VectorVest, Inc.
- Executive Premier Workshop
- One-Day Options Course
- OptionsPro
- Retirement Income Workshop
- Sure-Fire Trading Systems (VectorVest, Inc.)
- Trading as a Business Workshop
- VectorVest 7 EOD
- VectorVest 7 RealTime/IntraDay
- VectorVest AutoTester
- VectorVest Educational Services
- VectorVest OnLine
- VectorVest Options Analyzer
- VectorVest ProGraphics v6.0
- VectorVest ProTrader 7
- VectorVest RealTime Derby Tool
- VectorVest Simulator
- VectorVest Variator
- VectorVest Watchdog
