HOT TOPICS LIST
- MACD
- Fibonacci
- RSI
- Gann
- ADXR
- Stochastics
- Volume
- Triangles
- Futures
- Cycles
- Volatility
- ZIGZAG
- MESA
- Retracement
- Aroon
INDICATORS LIST
LIST OF TOPICS
PRINT THIS ARTICLE
by Matt Blackman
Divergence analysis using momentum indicators can assist traders in spotting potential trend changes weeks before they occur. Here, we examine what the Chaikin money flow indicator may be trying to tell us.
Position: N/A
Matt Blackman
Matt Blackman is a full-time technical and financial writer and trader. He produces corporate and financial newsletters, and assists clients in getting published in the mainstream media. He is the host of TradeSystemGuru.com. Matt has earned the Chartered Market Technician (CMT) designation. Find out what stocks and futures Matt is watching on Twitter at www.twitter.com/RatioTrade
PRINT THIS ARTICLE
MONEY FLOW INDEX
Where Are The Markets Headed From Here?
04/01/03 02:45:50 PMby Matt Blackman
Divergence analysis using momentum indicators can assist traders in spotting potential trend changes weeks before they occur. Here, we examine what the Chaikin money flow indicator may be trying to tell us.
Position: N/A
| Developed by Marc Chaikin, the Chaikin money flow (CMF) indicator is based on the principle that changes in price should be accompanied by similar changes in volume. In a bull market, as volume rises so do prices and vice versa. This relationship is accompanied by prices closing in the upper half of their daily (or weekly on a weekly chart) price range. |
| In a bear market, however, the reverse is true. Volume rises on declining prices and when prices rise, volume drops. Prices also generally close in the lower half of their daily (or weekly) ranges. |

|
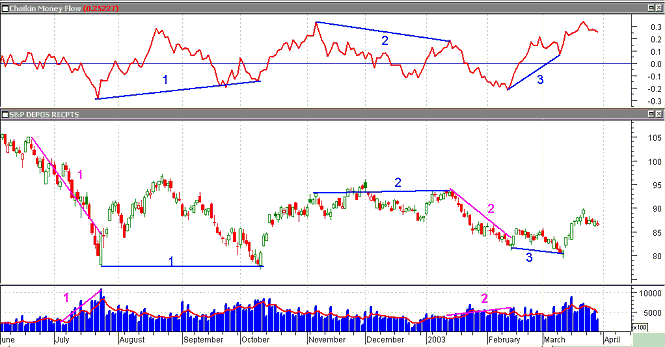
| Figure 1 – Daily Standard & Poor’s Deposits-Receipts (SPY) plotted against a 20-period Chaikin money flow (CMF) showing divergence with price. |
| Graphic provided by: MetaStock. |
| Graphic provided by: Data by eSignal. |
| |
| But of greater significance in determining future price movement is the divergence between price and the CMF. The indicator works by combining volume and price performance. When volume rises and prices close in the upper half of period ranges, the CMF rises. This often occurs well in advance of an upward move in prices. It shows that more buyers are purchasing the equity than are selling. In Figure 1, it is clear that even though prices were heading in one direction, when the CMF rose or fell, prices eventually followed. (See lines 1, 2 and 3.) Also note that volume rose as prices fell, a sign of a bear market. Beginning in late February and early March (see line 3), there was a strong positive divergence between price and the CMF. We have yet to witness strong increases in volume on rising prices, which indicate that market sentiment has changed from bearish to bullish. |
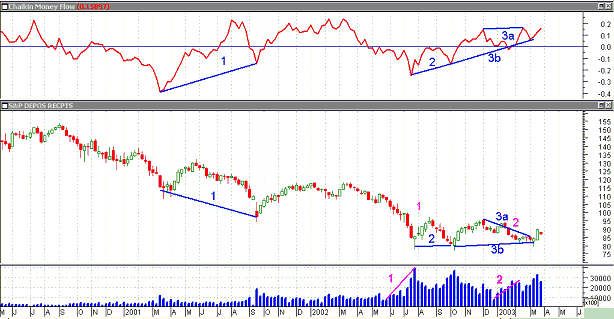
 Figure 2 - Weekly Standard & Poor's Deposits-Receipts (SPY) showing recent positive divergence between CMF and price. Such divergences are more visible on longer-term charts. In Figure 2, note the divergences in lines 1, 2, 3a, and 3b. Lines 2 and 3b on the CMF chart demonstrate strong positive divergence with price suggesting that we may see more bullish price movement in the days to come. What will markets need to show if this latest bull move is to resume? The markets will need to show growing volume support as prices rise, which will show that market participants are becoming more and more optimistic that the stock they buy today will be worth more in the coming weeks. |
| Technically speaking, indicator movement should not be acted upon until there is concrete evidence that major trendlines have been broken on rising volume. These trendlines in both the daily and weekly SPY charts are still heading down at about 30 degrees. Like a lumbering oil tanker making a U-turn at sea, a major market reversal does not occur quickly. But it is something that is hard to keep a secret from those who know how to read the signs. |
Matt Blackman is a full-time technical and financial writer and trader. He produces corporate and financial newsletters, and assists clients in getting published in the mainstream media. He is the host of TradeSystemGuru.com. Matt has earned the Chartered Market Technician (CMT) designation. Find out what stocks and futures Matt is watching on Twitter at www.twitter.com/RatioTrade
| Company: | TradeSystemGuru.com |
| Address: | Box 2589 |
| Garibaldi Highlands, BC Canada | |
| Phone # for sales: | 604-898-9069 |
| Fax: | 604-898-9069 |
| Website: | www.tradesystemguru.com |
| E-mail address: | indextradermb@gmail.com |
Traders' Resource Links | |
| TradeSystemGuru.com has not added any product or service information to TRADERS' RESOURCE. | |
Click here for more information about our publications!
PRINT THIS ARTICLE

Request Information From Our Sponsors
- StockCharts.com, Inc.
- Candle Patterns
- Candlestick Charting Explained
- Intermarket Technical Analysis
- John Murphy on Chart Analysis
- John Murphy's Chart Pattern Recognition
- John Murphy's Market Message
- MurphyExplainsMarketAnalysis-Intermarket Analysis
- MurphyExplainsMarketAnalysis-Visual Analysis
- StockCharts.com
- Technical Analysis of the Financial Markets
- The Visual Investor
- VectorVest, Inc.
- Executive Premier Workshop
- One-Day Options Course
- OptionsPro
- Retirement Income Workshop
- Sure-Fire Trading Systems (VectorVest, Inc.)
- Trading as a Business Workshop
- VectorVest 7 EOD
- VectorVest 7 RealTime/IntraDay
- VectorVest AutoTester
- VectorVest Educational Services
- VectorVest OnLine
- VectorVest Options Analyzer
- VectorVest ProGraphics v6.0
- VectorVest ProTrader 7
- VectorVest RealTime Derby Tool
- VectorVest Simulator
- VectorVest Variator
- VectorVest Watchdog
