HOT TOPICS LIST
- MACD
- Fibonacci
- RSI
- Gann
- ADXR
- Stochastics
- Volume
- Triangles
- Futures
- Cycles
- Volatility
- ZIGZAG
- MESA
- Retracement
- Aroon
INDICATORS LIST
LIST OF TOPICS
PRINT THIS ARTICLE
by Gary Grosschadl
This Canadian tech heavy weight, known for its Blackberry wireless platform / pager, trades on both sides of the border and has plenty of resistance going forward.
Position: Hold
Gary Grosschadl
Independent Canadian equities trader and technical analyst based in Peterborough
Ontario, Canada.
PRINT THIS ARTICLE
CHART ANALYSIS
Research In Motion Faces Quadruple Resistance
03/31/03 03:09:02 PMby Gary Grosschadl
This Canadian tech heavy weight, known for its Blackberry wireless platform / pager, trades on both sides of the border and has plenty of resistance going forward.
Position: Hold
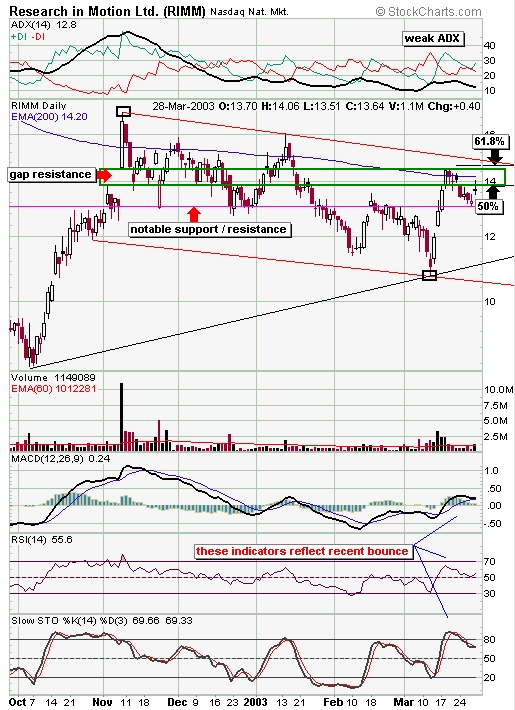
| The 6 month chart shows two patterns present - a neutral symmetrical triangle and a downtrending channel contained within. If the previous trend continues without a pattern break, then a bounce off the higher shared trendline is a reasonable probability. |
| A closer examination of various probable resistances not only adds weight to this idea of trendline failure but also suggests the failure could come just short of this upper trendline. The previous gap from last November has come into play as the last strong uptrend was halted at the top of that gap ~ $14.50. A balk here was also reinforced by the very close proximity of the 200-day EMA and a prominent 61.8% Fibonacci retracement level (the small black rectangles show the 100 & 0 percent levels used for this retracement level). This gap resistance area was made particularily notable since both sides of the gap related to Fibonacci levels of 50 and 61.8 percent, as the black arrows show. The retracement that followed brought the stock back to an area of previous support and resistance as marked by the horizontal line. |

|
| 6 month daily chart |
| Graphic provided by: stockcharts.com. |
| |
| Currently the stock has gapped back up to this gap resistance zone via a doji candlestick. This doji represents indecision or a balance between bulls and bears and suggests a failure of this latest upside momentum. Looking at the top indicator, we see a weak ADX line at 12.8 reading. This also suggests a lack of directional power. The indicators below the chart reflect this bounce attempt as the RSI (relative strength indicator) tries to bounce off 50 while the other two attempt to flatten out. |
| The patient and prudent trader should wait to see how this plays out. If the potentially bearish doji is negated to the upside, then a move towards the upper trendline may ensue. Failure at or near this trendline should be closely watched for a shorting opportunity via a suitable reversal pattern i.e. bearish engulfing, dark cloud cover or similar candle breakdown. Initial downside target would be this horizontal support / resistance line ~ $13.20. The other possibility would be that this doji is respected with a move to the downside. In this case I wouldn't trust a possible short position until this same line at ~ $13.20 breaks to the downside as another bounce or reversal possibility exists. There is plenty of room below this line to make a favourable play as the lower trendlines are a good deal lower provided that $12 support doesn't kick in. |
| In summary there is plenty of upside resistance that this stock has to overcome. Unless the overall market decides to make a very bullish move up, this play will likely sucuumb to bearish pressure afforded by four resistance levels (trendline, gap, 200 EMA and Fibonacci retracement) approximately between $14 - 15. |
Independent Canadian equities trader and technical analyst based in Peterborough
Ontario, Canada.
| Website: | www.whatsonsale.ca/financial.html |
| E-mail address: | gwg7@sympatico.ca |
Click here for more information about our publications!
Comments
Date: 04/06/03Rank: 3Comment:

|

Request Information From Our Sponsors
- StockCharts.com, Inc.
- Candle Patterns
- Candlestick Charting Explained
- Intermarket Technical Analysis
- John Murphy on Chart Analysis
- John Murphy's Chart Pattern Recognition
- John Murphy's Market Message
- MurphyExplainsMarketAnalysis-Intermarket Analysis
- MurphyExplainsMarketAnalysis-Visual Analysis
- StockCharts.com
- Technical Analysis of the Financial Markets
- The Visual Investor
- VectorVest, Inc.
- Executive Premier Workshop
- One-Day Options Course
- OptionsPro
- Retirement Income Workshop
- Sure-Fire Trading Systems (VectorVest, Inc.)
- Trading as a Business Workshop
- VectorVest 7 EOD
- VectorVest 7 RealTime/IntraDay
- VectorVest AutoTester
- VectorVest Educational Services
- VectorVest OnLine
- VectorVest Options Analyzer
- VectorVest ProGraphics v6.0
- VectorVest ProTrader 7
- VectorVest RealTime Derby Tool
- VectorVest Simulator
- VectorVest Variator
- VectorVest Watchdog
