HOT TOPICS LIST
- MACD
- Fibonacci
- RSI
- Gann
- ADXR
- Stochastics
- Volume
- Triangles
- Futures
- Cycles
- Volatility
- ZIGZAG
- MESA
- Retracement
- Aroon
INDICATORS LIST
LIST OF TOPICS
PRINT THIS ARTICLE
by David Penn
A "third strike" looms against the rally in copper futures.
Position: N/A
David Penn
Technical Writer for Technical Analysis of STOCKS & COMMODITIES magazine, Working-Money.com, and Traders.com Advantage.
PRINT THIS ARTICLE
REVERSAL
Revisiting Copper Tops
03/26/03 02:20:42 PMby David Penn
A "third strike" looms against the rally in copper futures.
Position: N/A
| A reader recently asked about a Traders.com Advantage piece I wrote almost a month ago warning of a bearish reversal possibility in copper futures ("Copper Tops", Traders.com Advantage, February 28, 2003). In that piece, I used a pair of reversal strategies introduced by Victor Sperandeo in his pair of trading books, Methods of a Wall Street Master and Principles of Professional Speculation. The two methods were the 1-2-3 trend reversal and the 2B test of top. |
| Without repeating what was written in "Copper Tops", know that the first method, the 1-2-3 trend reversal operates on the premise that once a trendline is broken (1) and the attempt to resume the trend fails (2), the likelihood of a reversal is strong (3). In the previous analysis of copper, I noted that the March contract saw copper futures experience a 1-2-3 trend reversal set-up at the beginning of February. The trendline was broken to the downside, the snapback rally failed to penetrate the support-turned-resistance of the old trendline, and prices subsequently declined. |

|
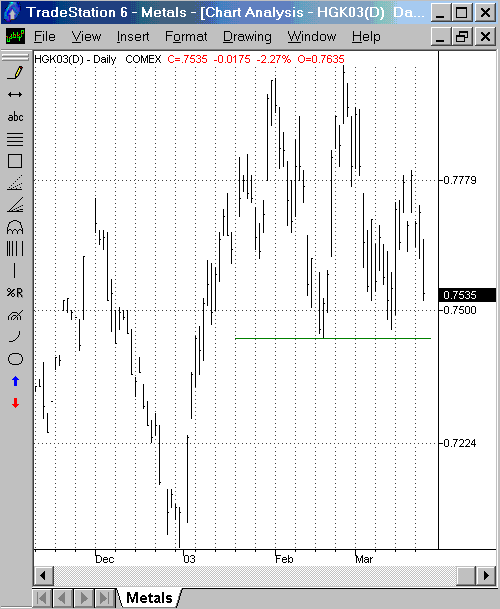
| Figure 1: After failing to follow-through on new highs in late February, copper futures move to test support. |
| Graphic provided by: TradeStation. |
| |
| After falling some 380 points from the breakdown point, copper futures found support and rallied strongly, making a new closing high late in February. Here is where the 2B test of top strategy became useful. The 2B test of top suggests that when prices make a new high, retreat, then notch an even higher high, any failure to follow through on the higher high should be viewed with the suspicion that the higher high may not hold and that a decline may be in the making. Just such was the case as copper futures retreated sharply from the higher high at 0.7975, eventually finding support more than 400 points lower at 0.7500 (basis March). |
| Generally speaking, this level has been support for the May copper contract as well (actual support is closer to 0.7437). It appears as if copper futures are at an important make or break point. If they fall through support, then a decline (based on the rally peak in late February) of up to 600 points could be next. Such a decline would take May copper to lows in the area of 0.6837. In fact, the price action from January 2003 to present in May copper has some head and shoulders top characteristics--given the rally peaks in late January and the significantly lower rally peak in mid-March. |
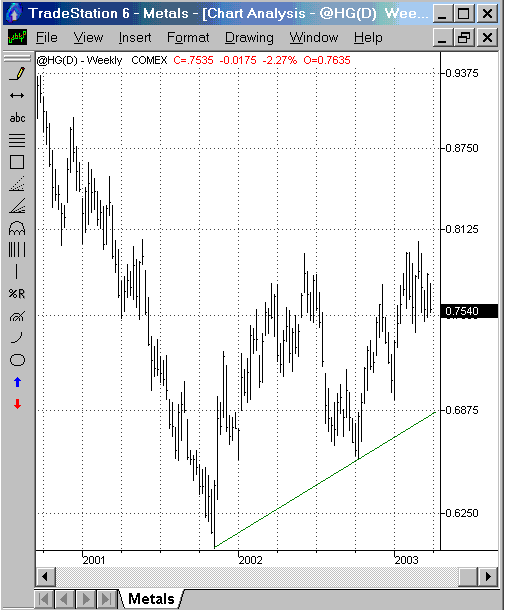
 Figure 2: Even a sharp, short-term decline would not necessarily mean the end of copper's longer-term uptrend. But regardless of any head and shoulders pattern that may or may not be developing (a "third strike") in May copper, it is clear that a consolidation of some significance has developed. Looking at a weekly chart of continuous copper futures, we can note an uptrend line that extends from the November 2001 lows. While this uptrend--if authentic--does suggest that the longer-term trend in copper futures is still up, it also shows that the longer-term uptrend could suffer significant losses and still remain technically intact. Even a decline to the level of the January lows--a sharp decline for a copper bull at this point--would not necessarily negate the uptrend in copper shown in the chart of continuous futures. |
Technical Writer for Technical Analysis of STOCKS & COMMODITIES magazine, Working-Money.com, and Traders.com Advantage.
| Title: | Technical Writer |
| Company: | Technical Analysis, Inc. |
| Address: | 4757 California Avenue SW |
| Seattle, WA 98116 | |
| Phone # for sales: | 206 938 0570 |
| Fax: | 206 938 1307 |
| Website: | www.Traders.com |
| E-mail address: | DPenn@traders.com |
Traders' Resource Links | |
| Charting the Stock Market: The Wyckoff Method -- Books | |
| Working-Money.com -- Online Trading Services | |
| Traders.com Advantage -- Online Trading Services | |
| Technical Analysis of Stocks & Commodities -- Publications and Newsletters | |
| Working Money, at Working-Money.com -- Publications and Newsletters | |
| Traders.com Advantage -- Publications and Newsletters | |
| Professional Traders Starter Kit -- Software | |
Click here for more information about our publications!
Comments

Request Information From Our Sponsors
- StockCharts.com, Inc.
- Candle Patterns
- Candlestick Charting Explained
- Intermarket Technical Analysis
- John Murphy on Chart Analysis
- John Murphy's Chart Pattern Recognition
- John Murphy's Market Message
- MurphyExplainsMarketAnalysis-Intermarket Analysis
- MurphyExplainsMarketAnalysis-Visual Analysis
- StockCharts.com
- Technical Analysis of the Financial Markets
- The Visual Investor
- VectorVest, Inc.
- Executive Premier Workshop
- One-Day Options Course
- OptionsPro
- Retirement Income Workshop
- Sure-Fire Trading Systems (VectorVest, Inc.)
- Trading as a Business Workshop
- VectorVest 7 EOD
- VectorVest 7 RealTime/IntraDay
- VectorVest AutoTester
- VectorVest Educational Services
- VectorVest OnLine
- VectorVest Options Analyzer
- VectorVest ProGraphics v6.0
- VectorVest ProTrader 7
- VectorVest RealTime Derby Tool
- VectorVest Simulator
- VectorVest Variator
- VectorVest Watchdog
