

HOT TOPICS LIST
- MACD
- Fibonacci
- RSI
- Gann
- ADXR
- Stochastics
- Volume
- Triangles
- Futures
- Cycles
- Volatility
- ZIGZAG
- MESA
- Retracement
- Aroon
INDICATORS LIST
LIST OF TOPICS
PRINT THIS ARTICLE
by Gary Grosschadl
The Chicago Board Options Exchange Volatility Index is used by stock and options traders to monitor the market's anxiety level.
Position: N/A
Gary Grosschadl
Independent Canadian equities trader and technical analyst based in Peterborough
Ontario, Canada.
PRINT THIS ARTICLE
SYMMETRICAL TRIANGLE
VIX Analyzed
03/31/03 02:29:39 PMby Gary Grosschadl
The Chicago Board Options Exchange Volatility Index is used by stock and options traders to monitor the market's anxiety level.
Position: N/A
| The VIX is a mathematical measure of how much the market thinks the S&P 100 index option (OEX) will fluctuate over the next 12 months based on the difference between put and call options. For contrarians, low readings for the VIX are bearish, while high readings are bullish. My previous observations show that the Nasdaq has great correlation to VIX despite the OEX orientation (no surprise really as these indices so often mirror each other). This essentially is an inverse relationship. As the markets go up the VIX moves down and vice versa. Traders often watch the VIX for clues as to where the market may turn. |
| This 10-month daily chart shows the VIX in a large symmetrical triangle. This pattern is considered neutral until there is a sustainable break outside either of the trendlines. However distinct moves towards the trendlines or bounces off them are often tradeable. Currently the VIX has moved to the center of its triangle, however there are several clues that may help decipher which way it goes. The volatile action of the past few days has sent this index whipsawing through the 200-day EMA. However there are three areas of support nearby which could deliver the markets to the bears once again or at least provide a likely important test. |
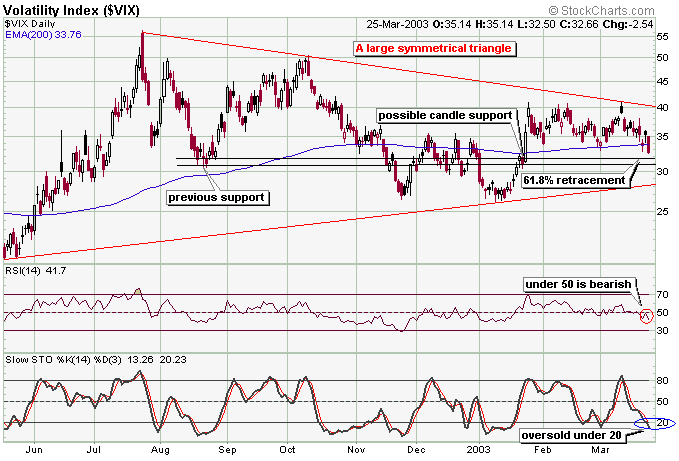
|
| Graphic provided by: stockcharts.com. |
| |
| Using the last two trendline touches for Fibonacci retracement measures (VIX 41.6 = 0 % and VIX 26.09 = 100 %), the often significant 61.8 % is at VIX 31.92 (as shown on chart). This area also relates to two other possible support areas in close proximity. The base of a previous large candlestick and a previous support from last August (where a bounce ensued) both add weight to the notion of likely support between VIX 31-32. Either way, whatever happens at this proposed support test should be significant. A bounce up likely being accompanied by a sizable/tradeable move down for the Nasdaq/Dow while a fall through this support zone would imply a move towards bottom trendline and a correlating bullish move up for the main indices. |
| The displayed indicators are showing a mixed picture as the VIX has not tipped its hand yet. Stochastics are in oversold territory hinting at a bounce soon while the RSI (relative strength index) is showing bearish intent with this move below the 50 level. |
| To summarize, watch this proposed support zone ~ VIX 31-32 carefully. What happens there will likely tip the market's hand in the short term. A bigger move will eventually occur once the symmetrical triangle trendline is broken with some conviction, in the meantime a strong move to either trendline may be tradeable. |
Independent Canadian equities trader and technical analyst based in Peterborough
Ontario, Canada.
| Website: | www.whatsonsale.ca/financial.html |
| E-mail address: | gwg7@sympatico.ca |
Click here for more information about our publications!
Comments
Date:�04/01/03Rank:�5Comment:�
Date:�04/01/03Rank:�2Comment:�

Request Information From Our Sponsors
- StockCharts.com, Inc.
- Candle Patterns
- Candlestick Charting Explained
- Intermarket Technical Analysis
- John Murphy on Chart Analysis
- John Murphy's Chart Pattern Recognition
- John Murphy's Market Message
- MurphyExplainsMarketAnalysis-Intermarket Analysis
- MurphyExplainsMarketAnalysis-Visual Analysis
- StockCharts.com
- Technical Analysis of the Financial Markets
- The Visual Investor
- VectorVest, Inc.
- Executive Premier Workshop
- One-Day Options Course
- OptionsPro
- Retirement Income Workshop
- Sure-Fire Trading Systems (VectorVest, Inc.)
- Trading as a Business Workshop
- VectorVest 7 EOD
- VectorVest 7 RealTime/IntraDay
- VectorVest AutoTester
- VectorVest Educational Services
- VectorVest OnLine
- VectorVest Options Analyzer
- VectorVest ProGraphics v6.0
- VectorVest ProTrader 7
- VectorVest RealTime Derby Tool
- VectorVest Simulator
- VectorVest Variator
- VectorVest Watchdog