HOT TOPICS LIST
- MACD
- Fibonacci
- RSI
- Gann
- ADXR
- Stochastics
- Volume
- Triangles
- Futures
- Cycles
- Volatility
- ZIGZAG
- MESA
- Retracement
- Aroon
INDICATORS LIST
LIST OF TOPICS
PRINT THIS ARTICLE
by Matt Blackman
It has now been eight days since markets began their upward march, but the run is showing signs of strain.
Position: N/A
Matt Blackman
Matt Blackman is a full-time technical and financial writer and trader. He produces corporate and financial newsletters, and assists clients in getting published in the mainstream media. He is the host of TradeSystemGuru.com. Matt has earned the Chartered Market Technician (CMT) designation. Find out what stocks and futures Matt is watching on Twitter at www.twitter.com/RatioTrade
PRINT THIS ARTICLE
TECHNICAL ANALYSIS
SPY - A Market Proxy
03/25/03 10:59:16 AMby Matt Blackman
It has now been eight days since markets began their upward march, but the run is showing signs of strain.
Position: N/A
| During the eight-day period ending March 21, the markets made some spectacular gains. The Dow Industrial Average ($INDU) gained 13%, the S&P500 ($SPX) and Nasdaq Composite Index ($COMPQ) both rose 12%. However, the advances have left many traders scratching their heads wondering what is causing this recent phenomenon and if there is any real strength behind it. |
| As a proxy for broader markets, the Standard & Poors Deposit-Receipts (SPY) provides the technical analyst and trader with a barometer of market sentiment. Unlike the above indexes, the SPY includes a volume component, thereby permitting more indepth analysis. To many, volume is as important as price in generating buy and sell signals. |

|
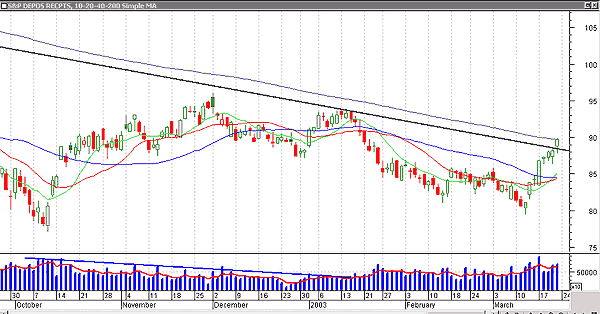
| Figure 1 – Standard & Poor’s Deposit-Receipts (SPY) with black trendline and 10-, 20-, 40- and 200-day simple moving averages (SMA). Note that the latest close touched the 200-day MA. |
| Graphic provided by: MetaStock. |
| |
| Last week's large move could be a repetition of the launch of the Gulf War in 1991 when markets jumped more than 18% in the first 15 days of conflict. The eight-day rise this time around is the longest sustained day-to-day rally in more than four years. For those who are feeling optimistic that the bear may finally be over, there are a number of technical "red flags" that cannot be ignored. |
| First, generally a rise runs into overhead resistance in the third to fifth green (upward) candle. How the market responds once the momentum has subsided will tell all. Secondly, in touching the 200-day SMA, an equity will encounter significant resistance, especially given the distance between the latest closing price and the 10-, 20- and 40-day SMAs. Finally, oscillators such as the stochastic RSI, relative strength index (RSI) and ultimate indicator are all glued in overbought territory, suggesting that either a consolidation or retracement is overdue. Traders will also be watching volume closely for a decline that could signal a drop in price. |
| Fundamentally, the gains appear to be a relief rally fueled by some short covering but it will take a lot more than relief to keep this drive alive. When it finally begins to show signs of weakness, look for bears to appear from the woodwork, especially if prices appear overly susceptible to selling pressure in the coming days. |
Matt Blackman is a full-time technical and financial writer and trader. He produces corporate and financial newsletters, and assists clients in getting published in the mainstream media. He is the host of TradeSystemGuru.com. Matt has earned the Chartered Market Technician (CMT) designation. Find out what stocks and futures Matt is watching on Twitter at www.twitter.com/RatioTrade
| Company: | TradeSystemGuru.com |
| Address: | Box 2589 |
| Garibaldi Highlands, BC Canada | |
| Phone # for sales: | 604-898-9069 |
| Fax: | 604-898-9069 |
| Website: | www.tradesystemguru.com |
| E-mail address: | indextradermb@gmail.com |
Traders' Resource Links | |
| TradeSystemGuru.com has not added any product or service information to TRADERS' RESOURCE. | |
Click here for more information about our publications!
Comments
Date: 04/01/03Rank: 5Comment:
Date: 04/06/03Rank: 5Comment:

Request Information From Our Sponsors
- StockCharts.com, Inc.
- Candle Patterns
- Candlestick Charting Explained
- Intermarket Technical Analysis
- John Murphy on Chart Analysis
- John Murphy's Chart Pattern Recognition
- John Murphy's Market Message
- MurphyExplainsMarketAnalysis-Intermarket Analysis
- MurphyExplainsMarketAnalysis-Visual Analysis
- StockCharts.com
- Technical Analysis of the Financial Markets
- The Visual Investor
- VectorVest, Inc.
- Executive Premier Workshop
- One-Day Options Course
- OptionsPro
- Retirement Income Workshop
- Sure-Fire Trading Systems (VectorVest, Inc.)
- Trading as a Business Workshop
- VectorVest 7 EOD
- VectorVest 7 RealTime/IntraDay
- VectorVest AutoTester
- VectorVest Educational Services
- VectorVest OnLine
- VectorVest Options Analyzer
- VectorVest ProGraphics v6.0
- VectorVest ProTrader 7
- VectorVest RealTime Derby Tool
- VectorVest Simulator
- VectorVest Variator
- VectorVest Watchdog
