

HOT TOPICS LIST
- MACD
- Fibonacci
- RSI
- Gann
- ADXR
- Stochastics
- Volume
- Triangles
- Futures
- Cycles
- Volatility
- ZIGZAG
- MESA
- Retracement
- Aroon
INDICATORS LIST
LIST OF TOPICS
PRINT THIS ARTICLE
by Kevin Hopson
Apache Corp. (APA) had been in a steep uptrend since late last year. However, the stock recently broke its long-term uptrend line, which has now turned into resistance.
Position: Hold
Kevin Hopson
Kevin has been a technical analyst for roughly 10 years now. Previously, Kevin owned his own business and acted as a registered investment advisor, specializing in energy. He was also a freelance oil analyst for Orient Trading Co., a commodity futures trading firm in Japan. Kevin is currently a freelance writer.
PRINT THIS ARTICLE
TREND-CHANNEL
Support Turned Resistance for Apache Corp.
03/25/03 10:57:27 AMby Kevin Hopson
Apache Corp. (APA) had been in a steep uptrend since late last year. However, the stock recently broke its long-term uptrend line, which has now turned into resistance.
Position: Hold
| Apache Corp. (APA) is an oil and gas exploration and production company with interests in the US, Canada, Egypt, Australia, China, Poland and Argentina. Technically speaking, the stock broke key support earlier this month and is now finding resistance along its former uptrend line. However, it is important to look at the big picture to gain a better perspective on this. |
| For example, notice how Apache's stock price had been contained within the black pitchfork configuration for several months. A breach of Apache's long-term uptrend line (lower black parallel line) occurred in mid-February, as indicated by the first green circle. However, the median line of the blue pitchfork eventually supported prices, allowing Apache to reverse higher. As a result, a sliding red parallel line (warning line) was drawn from this pivot low. I will touch on the significance of this line later on in the article. |
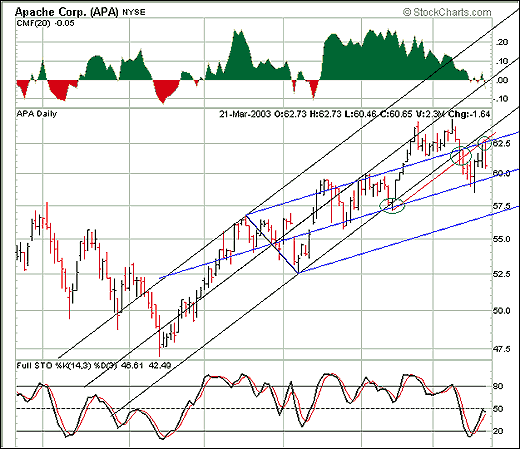
|
| Graphic provided by: StockCharts.com. |
| |
| After prices reversed, Apache proceeded to hit a new 52-week high, eventually topping out around the $65.00 level. Once the stock began to pull back, the $62.00 level became a key support area, the reason being that Apache's long-term uptrend line and the top blue parallel line - which had acted as prior resistance - both intersected here. Additionally, the sliding red parallel line was coming into play. As you can see in the second green circle, the stock breached all three of these trendlines. |
| If prices had bounced off the sliding red parallel line and moved higher, the trend (though slightly broken again) would remain intact for the most part. However, because the stock broke the sliding red parallel line, it was a warning - or sell signal - to traders. Once this occurred, it was likely that Apache would find opposition along these trendlines, as prior support tends to turn into resistance. More specifically, notice how the sliding red parallel line and the top blue parallel line have intersected in the $62.50 to $63.00 range. Not coincidentally, Apache topped out here on Friday and proceeded to pull back, as seen in the third green circle. |
Kevin has been a technical analyst for roughly 10 years now. Previously, Kevin owned his own business and acted as a registered investment advisor, specializing in energy. He was also a freelance oil analyst for Orient Trading Co., a commodity futures trading firm in Japan. Kevin is currently a freelance writer.
| Glen Allen, VA | |
| E-mail address: | hopson_1@yahoo.com |
Click here for more information about our publications!
PRINT THIS ARTICLE

Request Information From Our Sponsors
- StockCharts.com, Inc.
- Candle Patterns
- Candlestick Charting Explained
- Intermarket Technical Analysis
- John Murphy on Chart Analysis
- John Murphy's Chart Pattern Recognition
- John Murphy's Market Message
- MurphyExplainsMarketAnalysis-Intermarket Analysis
- MurphyExplainsMarketAnalysis-Visual Analysis
- StockCharts.com
- Technical Analysis of the Financial Markets
- The Visual Investor
- VectorVest, Inc.
- Executive Premier Workshop
- One-Day Options Course
- OptionsPro
- Retirement Income Workshop
- Sure-Fire Trading Systems (VectorVest, Inc.)
- Trading as a Business Workshop
- VectorVest 7 EOD
- VectorVest 7 RealTime/IntraDay
- VectorVest AutoTester
- VectorVest Educational Services
- VectorVest OnLine
- VectorVest Options Analyzer
- VectorVest ProGraphics v6.0
- VectorVest ProTrader 7
- VectorVest RealTime Derby Tool
- VectorVest Simulator
- VectorVest Variator
- VectorVest Watchdog