HOT TOPICS LIST
- MACD
- Fibonacci
- RSI
- Gann
- ADXR
- Stochastics
- Volume
- Triangles
- Futures
- Cycles
- Volatility
- ZIGZAG
- MESA
- Retracement
- Aroon
INDICATORS LIST
LIST OF TOPICS
PRINT THIS ARTICLE
by Gary Grosschadl
The battle between these currencies is obvious via the mirror image-like moves. They both showed a strong reversal pattern.
Position: N/A
Gary Grosschadl
Independent Canadian equities trader and technical analyst based in Peterborough
Ontario, Canada.
PRINT THIS ARTICLE
CHART ANALYSIS
US Dollar Index and Euro Index Show Rare Pattern
03/24/03 09:33:04 AMby Gary Grosschadl
The battle between these currencies is obvious via the mirror image-like moves. They both showed a strong reversal pattern.
Position: N/A
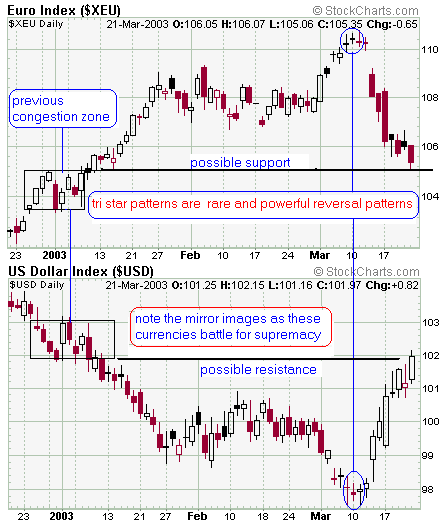
| Both these competing currencies showed a rare and significant reversal candlestick pattern called tri-stars. The Euro chart shows an ideal tri-star top which is very rare, composed of three doji lines as illustrated. The pattern confirmed strongly two days later with a strong gap move. A single doji marking a likely top or bottom can be a significant reversal pattern (evening or morning doji star) but a triple configuration in the form of a tri-star is a very strong reversal pattern and, as we can see, was very correct. What is surprising is that a similar pattern emerged at exactly the same time for the US dollar index. The ideal pattern is rare enough that "near" dojis still make for a strong pattern. The exact open and close for the last two $USD dojis were slightly off, making for a "thicker" middle for these near dojis. |
| No doubt those currency traders who correctly interpreted the significance of the tri-star bottom and top made a killing. However equity traders would have also been well served here as large movements and turns in the US dollar are accompanied by similar movements in the main indices. Bottom hammers for the main indices occurred as these tri-stars were confirmed for these currencies. |

|
| Figure 1: Daily chart of $USD and $XEU. |
| Graphic provided by: StockCharts.com. |
| |
| There may be valuable clues appearing on these charts now that may impact direction of the main indices going forward. The currency charts show previous congestion zones dead ahead. Previous congestion zones often come into play as these serve as areas of potential support and resistance. The currencies have a chance of at least taking a pause or breather in these immediate areas. A more extreme move would be either a quick bounce or a charge through the congestion zone. Either way, this will impact a likely similar move for the main indices. Perhaps this potential congestion area marks the end of the big move in the current direction, if not the move may pause here briefly before continuing in the same direction. |
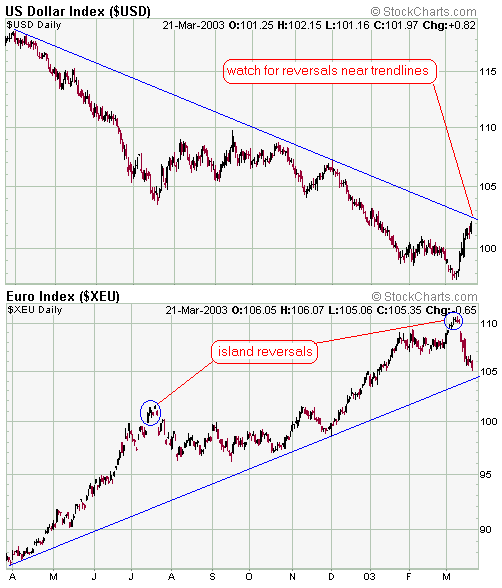
 Figure 2: One-year charts for $USD and $XEU. An examination of the one-year charts again shows the mirror image similarities, but more importantly shows that these currencies are near one-year trendlines. A reversal at or near these trendlines would make sense if the congestion areas discussed previously come into play. Since the trendlines are so near, whatever moves transpire should be sizeable ones. Look for a good move either way very soon. Traders should be prepared for both eventualities: a bullish move past this trendline or a bearish move away from it. To me it would seem appropriate that the tri-star move ends at a definitive level, and the trendline could be it. It should be mentioned that the 200-day EMA lies at 104.92, an important upside level. Should the USD push past the trendline (around 102.5), then this level may come into play. A further observation is made on the Euro chart, showing how well the past two island reversals worked. An island reversal is normally a topping out pattern with gaps either side of a set of data points. This "island" of data points is then left "stranded" as the downleg comes into play. In this manner the first chart showing the tri-stars also can be considered exhibiting island reversals even though one of them is a bottoming formation. |
Independent Canadian equities trader and technical analyst based in Peterborough
Ontario, Canada.
| Website: | www.whatsonsale.ca/financial.html |
| E-mail address: | gwg7@sympatico.ca |
Click here for more information about our publications!
Comments

Request Information From Our Sponsors
- StockCharts.com, Inc.
- Candle Patterns
- Candlestick Charting Explained
- Intermarket Technical Analysis
- John Murphy on Chart Analysis
- John Murphy's Chart Pattern Recognition
- John Murphy's Market Message
- MurphyExplainsMarketAnalysis-Intermarket Analysis
- MurphyExplainsMarketAnalysis-Visual Analysis
- StockCharts.com
- Technical Analysis of the Financial Markets
- The Visual Investor
- VectorVest, Inc.
- Executive Premier Workshop
- One-Day Options Course
- OptionsPro
- Retirement Income Workshop
- Sure-Fire Trading Systems (VectorVest, Inc.)
- Trading as a Business Workshop
- VectorVest 7 EOD
- VectorVest 7 RealTime/IntraDay
- VectorVest AutoTester
- VectorVest Educational Services
- VectorVest OnLine
- VectorVest Options Analyzer
- VectorVest ProGraphics v6.0
- VectorVest ProTrader 7
- VectorVest RealTime Derby Tool
- VectorVest Simulator
- VectorVest Variator
- VectorVest Watchdog
